THE POWER OF RELATIVE STRENGTH INDEX (RSI) IN THE STOCK MARKET: A VISUAL ANALYSIS
In the fast-paced world of stock trading, having the right tools and indicators can make a significant difference in decision-making. One such tool that holds immense importance is the Relative Strength Index (RSI). The RSI is a momentum oscillator that helps traders identify overbought and oversold conditions in the market. In this blog post, we will explore the significance of the Relative Strength Index as a technical indicator in the stock market, accompanied by visual representations of its applications.
Understanding the Relative Strength Index
The Relative Strength Index (RSI) is a popular and widely used oscillator that measures the speed and change of price movements in the market. It provides traders with insights into the strength and weakness of an asset's price momentum. The RSI is plotted on a scale ranging from 0 to 100 and is typically displayed as a line graph.
The RSI calculation involves comparing the average gains and losses over a specific period. Generally, a 14-day period is commonly used, but traders can adjust the time frame based on their trading preferences. The RSI is designed to identify potential overbought and oversold conditions, indicating when a market correction or reversal may occur.
Identifying Overbought and Oversold Conditions
The Relative Strength Index plays a vital role in identifying overbought and oversold conditions in the market. When the RSI value climbs above 70, it suggests that the market is overbought. This means that the asset's price has experienced a significant increase in a short period, indicating a potential reversal or correction. Traders can interpret this as a signal to consider selling or taking profits.
Conversely, when the RSI value drops below 30, it indicates that the market is oversold. This suggests that the asset's price has experienced a substantial decline, potentially creating a buying opportunity. Traders can view this as a signal to consider entering a long position or adding to existing positions.
Visual Representation: RSI Applied to a Stock Chart
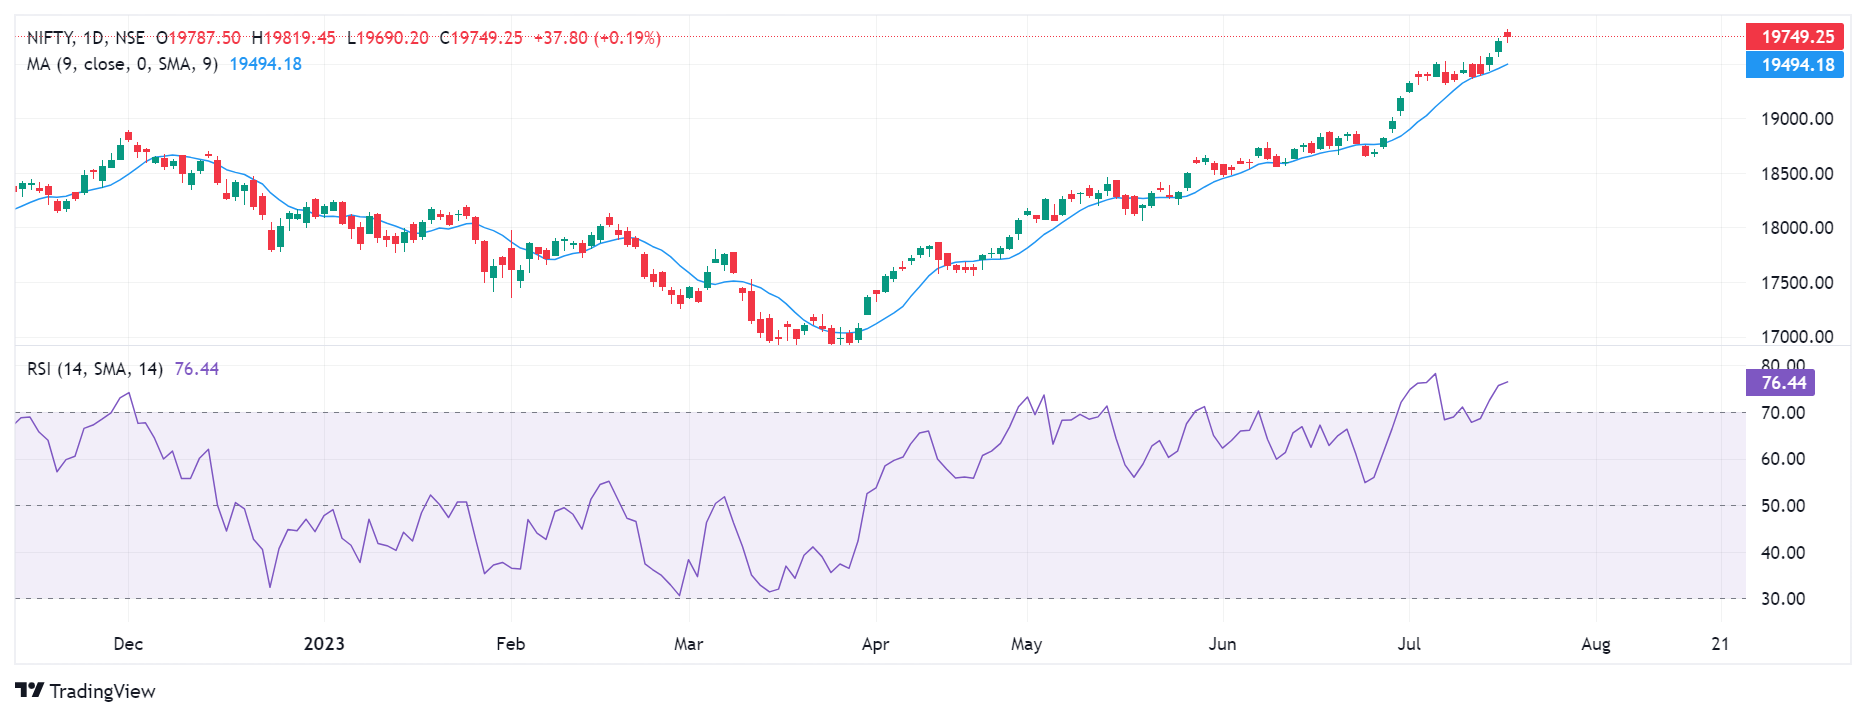
Let's consider a visual representation of the RSI applied to a stock chart to better understand its significance. Here is an example of the RSI displayed alongside the price chart of a hypothetical stock:

In this example, the RSI is plotted as a line graph below the price chart. The RSI ranges from 0 to 100, with the 70 and 30 levels marked for reference.
1. Overbought Condition: As the stock price experiences a significant increase, the RSI line rises above the 70 level, indicating an overbought condition. This suggests that the stock may be due for a correction or a downward price movement. Traders may consider selling or taking profits in anticipation of a potential reversal.
2. Oversold Condition: As the stock price declines sharply, the RSI line drops below the 30 level, indicating an oversold condition. This suggests that the stock may be undervalued and due for a price increase. Traders may view this as a buying opportunity and consider entering a long position or adding to existing positions.
3. Divergence: Another aspect to consider when analyzing the RSI is divergence. Divergence occurs when the direction of the RSI and the price chart differ. For example, if the stock price reaches a new high, but the RSI fails to surpass its previous peak, it is known as bearish divergence. This can indicate a potential trend reversal and serve as a warning sign for traders.
Conclusion
The Relative Strength Index (RSI) is a powerful technical indicator that helps traders identify overbought and oversold conditions in the stock market. By visually analyzing the RSI alongside price charts, traders can spot potential reversal points and make informed decisions. However, it is important to note that the RSI should not be used in isolation but in conjunction with other technical indicators and analysis tools. Additionally, traders should exercise proper risk management and consider the broader market context when utilizing the RSI to maximize its effectiveness in trading strategies.
Disclaimer: ICICI Securities Ltd. ( I-Sec). Registered office of I-Sec is at ICICI Securities Ltd. - ICICI Venture House, Appasaheb Marathe Marg, Prabhadevi, Mumbai - 400 025, India, Tel No : 022 - 6807 7100. I-Sec is a Member of National Stock Exchange of India Ltd (Member Code :07730), BSE Ltd (Member Code :103) and Member of Multi Commodity Exchange of India Ltd. ( Member Code : 56250) and having SEBI registration no. INZ000183631. Name of the Compliance officer (broking): Ms. Mamta Shetty, Contact number: 022-40701000, E-mail address: complianceofficer@icicisecurities.com. Investments in securities market are subject to market risks, read all the related documents carefully before investing. The contents herein above shall not be considered as an invitation or persuasion to trade or invest. I-Sec and affiliates accept no liabilities for any loss or damage of any kind arising out of any actions taken in reliance thereon. Investors should consult their financial advisers whether the product is suitable for them before taking any decision. The client shall not have any claim against I-Sec and/or its employees on account of any suspension, interruption, non-availability or malfunctioning of I-Sec system or service or non-execution of algo orders due to any link/system failure for any reason beyond I-Sec control. I-Sec reserves the right to pause, stop or call back any of the execution algos in case of any technical or mechanical exigency.
 Top Mutual Funds
