 Top Mutual Funds
- 31 Oct 2023
- ICICI Securities
-
Share
-

-

-

-

-

UNDERSTANDING CHARTING PATTERNS- FLAG
Understanding Charting patterns- Flag
Introduction
In the world of technical analysis, chart patterns are invaluable tools that offer traders a systematic way to understand market dynamics and make informed decisions. One such pattern that holds significant importance in stock trading is the "Flag." Flags are continuation patterns that can provide traders with valuable insights into potential price movements. In this blog, we'll delve into flag patterns in depth, using real-life examples from the Indian stock market to illustrate their relevance.
Understanding Flag Patterns
Flag patterns are a subset of continuation patterns that typically occur within strong and well-defined trends. They are characterized by a rectangular shape, resembling a flag, and are divided into two main types:
-
Bullish Flag: Bullish flags usually appear within an uptrend and suggest that the price is likely to continue rising. These patterns have a bullish bias.
-
Bearish Flag: Bearish flags typically manifest within a downtrend and indicate that the price is likely to continue declining. They have a bearish bias.
Let's explore real-life examples from the Indian stock market to gain a better understanding of both bullish and bearish flag patterns.
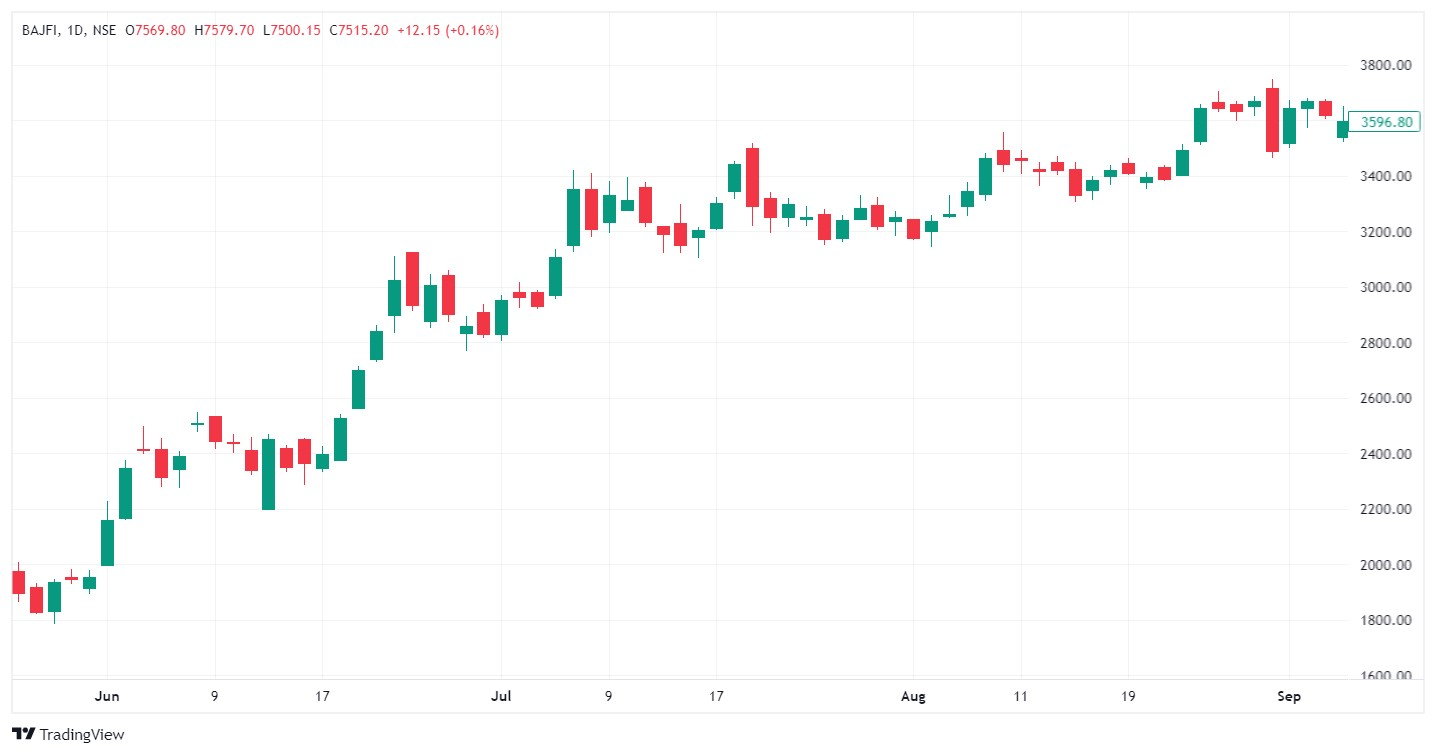
Bullish Flag Example: Bajaj Finance Limited (BAJFINANCE)
Bajaj Finance, a leading Indian non-banking financial company, exhibited a Bullish Flag pattern in 2020. This example illustrates how a Bullish Flag pattern can signal a potential continuation of an uptrend.
Here's a breakdown of the key elements:
-
Pattern Formation: The Bullish Flag pattern formed within a strong uptrend from June to September 2020. It took the shape of a rectangular flag, representing a brief consolidation period.
-
Signal Confirmation: As the stock's price approached the apex of the flag, it broke out to the upside, confirming the bullish pattern. This signaled the potential for the uptrend to resume.
-
Subsequent Movement: Following the breakout, Bajaj Finance's stock price continued its upward trajectory, aligning with the pattern's bullish implication.
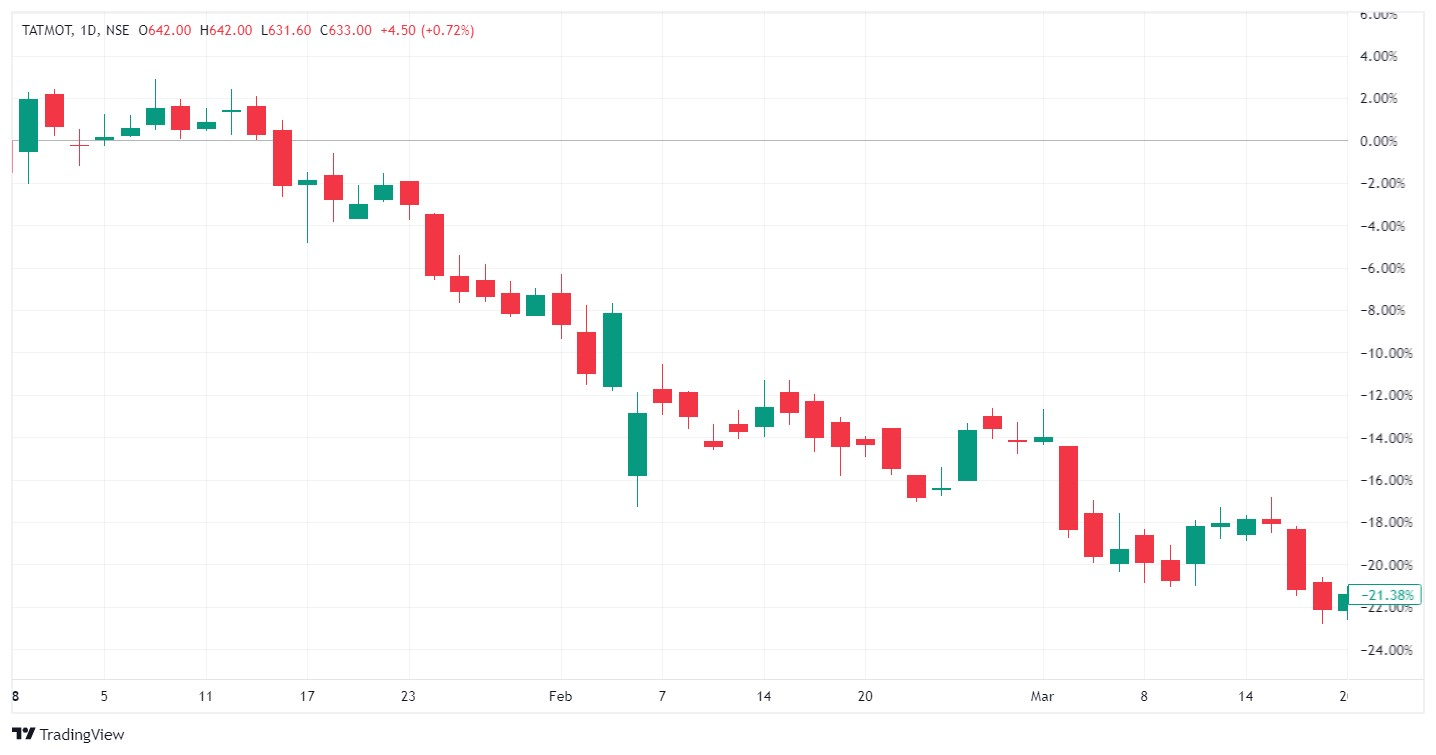
Bearish Flag Example: Tata Motors Limited (TATAMOTORS)
Tata Motors, a prominent Indian automotive company, displayed a Bearish Flag pattern in 2018. This example demonstrates how a Bearish Flag pattern can signal a potential continuation of a downtrend.
Here's a detailed analysis of this example:
-
Pattern Formation: The Bearish Flag pattern emerged within a well-defined downtrend from January to March 2018. It formed a rectangular flag shape, indicating a brief consolidation phase.
-
Signal Confirmation: As the stock's price approached the apex of the flag, it broke out to the downside, confirming the bearish pattern. This signaled the potential for the downtrend to persist.
-
Subsequent Movement: Following the breakout, Tata Motors' stock price continued its downward trajectory, aligning with the pattern's bearish implication.
Trading Flag Patterns in the Indian Market
Effectively trading flag patterns in the Indian stock market requires a systematic approach. Here are some key considerations:
-
Entry and Exit Points: For Bullish Flags, consider long positions when the price breaks out to the upside. For Bearish Flags, consider short positions when the price breaks out to the downside.
-
Volume Confirmation: Pay attention to trading volume when the price breaks out of the flag pattern. A breakout with significant volume is a stronger signal.
-
Price Targets: To estimate potential price targets, measure the flagpole's height (distance between the flag's high and low) and project it in the direction of the breakout.
-
Stop-Loss Orders: Implement stop-loss orders to manage risk. Place them just beyond the opposite side of the flag pattern to protect against false breakouts.
-
Timeframes: Flag patterns can appear on various timeframes, so choose one that aligns with your trading strategy.
Conclusion
Flag patterns, whether bullish or bearish, are valuable tools for traders in the Indian stock market. Recognizing these patterns, understanding their formation, and incorporating them with other technical analysis tools can enhance your trading decisions.
However, it's essential to remember that no pattern is foolproof, and risk management remains crucial in trading. Conduct thorough research and consider employing additional indicators and analysis methods to validate your trading decisions.
By mastering these patterns and combining them with a well-rounded trading strategy, you can navigate the Indian stock market with increased confidence and precision.