 Invest
- 31 Oct 2023
- ICICI Securities
-
Share
-

-

-

-

-

Understanding Charting patterns- Symmetrical triangle
Understanding Charting patterns- Symmetrical triangle
Introduction
Chart patterns are an essential tool for traders in the Indian stock market. Among the various chart patterns, the "Symmetrical Triangle" stands out as a versatile formation that provides insights into potential price movements. In this blog, we will delve into symmetrical triangles in depth, using real-life examples from the Indian stock market to illustrate their significance.
Understanding Symmetrical Triangle Patterns
A symmetrical triangle is a classic continuation pattern that occurs when the price moves within the confines of converging trend lines. It is characterized by two sloping trend lines that meet at a common point, forming a triangular shape. Symmetrical triangles can break out in either direction and are typically indicative of a forthcoming significant price move.
Let's explore real-life examples from the Indian stock market to gain a deeper understanding of symmetrical triangles.
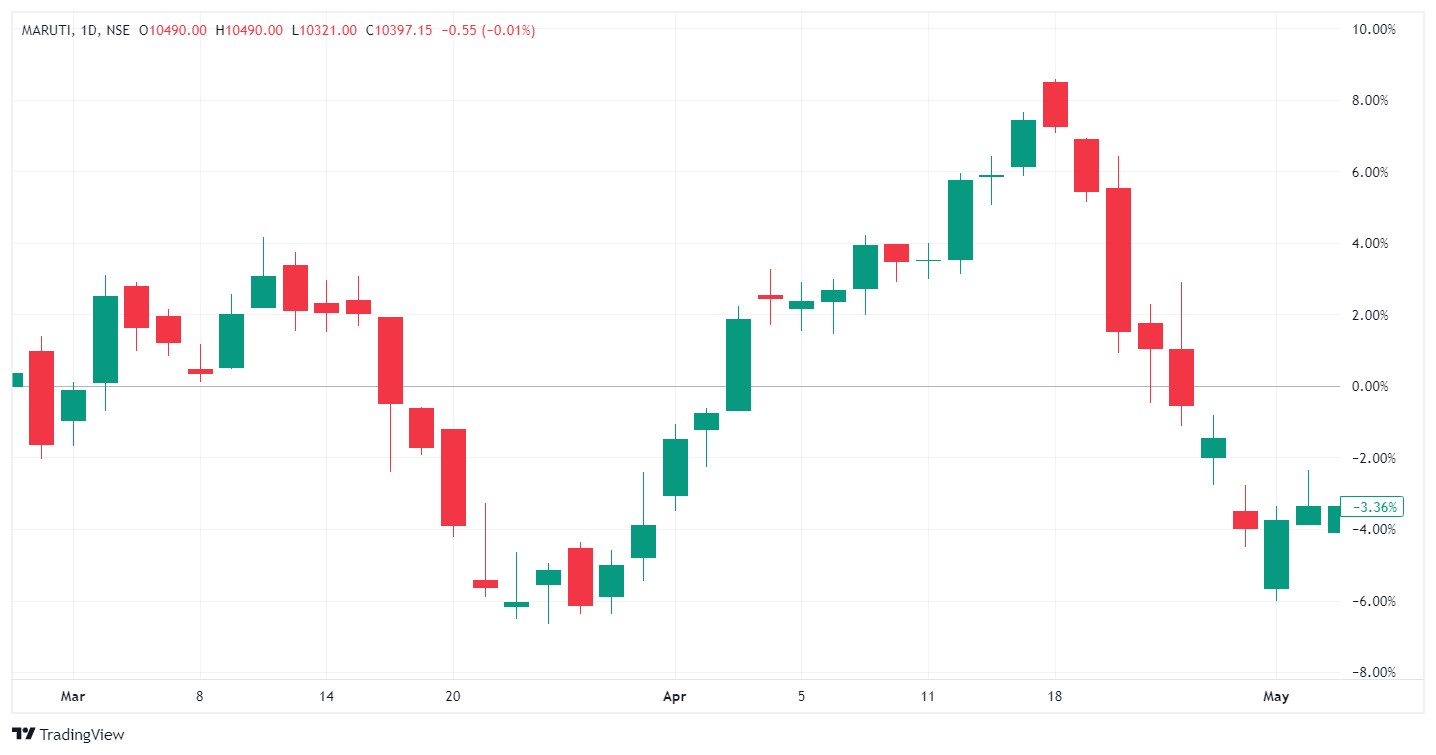
Symmetrical Triangle Example: Maruti Suzuki India Limited (MARUTI)
Maruti Suzuki, a leading Indian automobile manufacturer, exhibited a symmetrical triangle pattern in 2019. This example illustrates how a symmetrical triangle pattern can signal a potential significant price move.
Here's a breakdown of the key elements:
-
Pattern Formation: The symmetrical triangle pattern formed between March and May 2019 within a broader uptrend. It was characterized by two converging trendlines, creating the triangular shape.
-
Signal Confirmation: As the stock's price approached the apex of the triangle, it broke out to the upside, confirming the bullish pattern. This signaled the potential for a significant uptrend.
-
Subsequent Movement: Following the breakout, Maruti Suzuki's stock price continued its upward trajectory, aligning with the pattern's bullish implication.
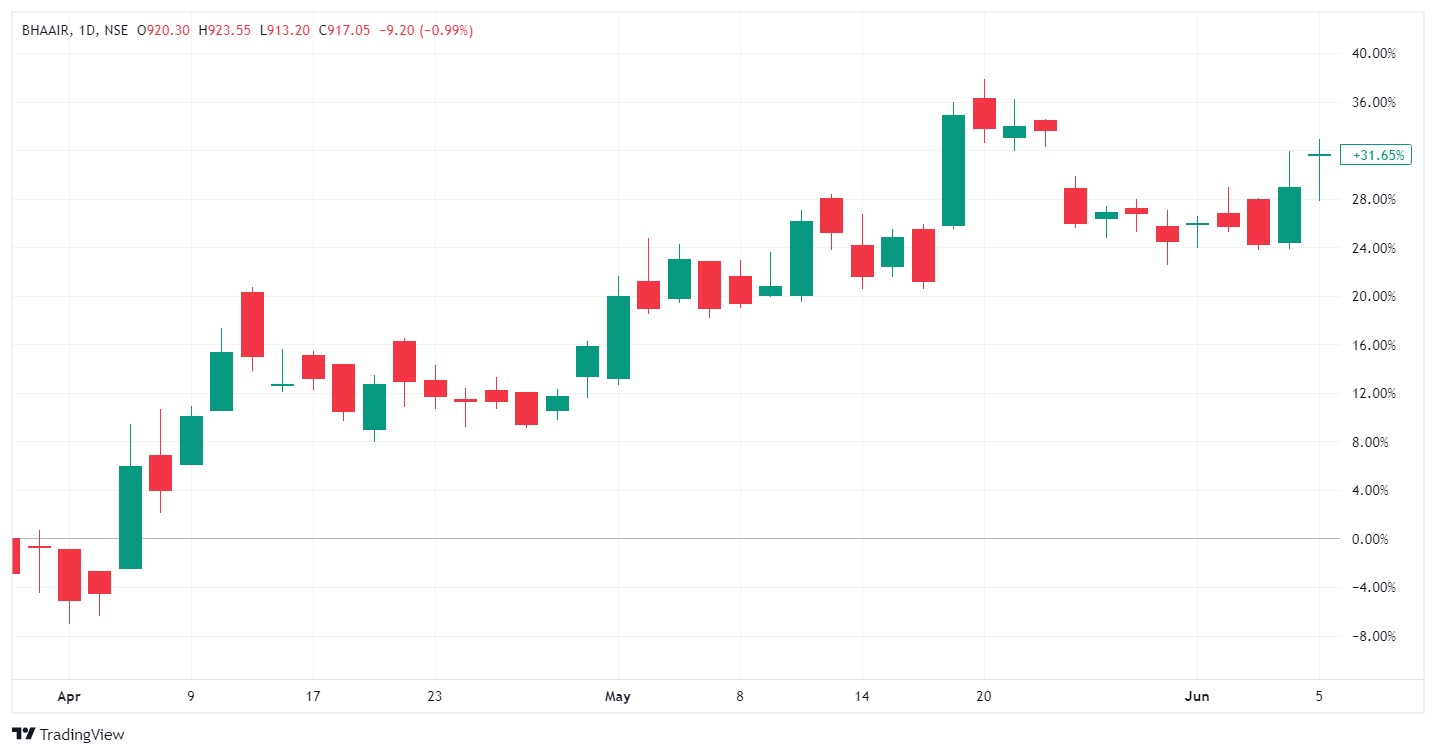
Symmetrical Triangle Example: Bharti Airtel Limited (BHARTIARTL)
Bharti Airtel, one of India's leading telecommunications companies, displayed a symmetrical triangle pattern in 2020. This example demonstrates how a symmetrical triangle pattern can signal a potential significant price move in a bearish direction.
Here's a detailed analysis of this example:
-
Pattern Formation: The symmetrical triangle pattern formed between April and June 2020 within a broader downtrend. It was characterized by two converging trendlines, creating the triangular shape.
-
Signal Confirmation: As the stock's price approached the apex of the triangle, it broke out to the downside, confirming the bearish pattern. This signaled the potential for a significant downtrend.
-
Subsequent Movement: Following the breakout, Bharti Airtel's stock price continued its downward trajectory, aligning with the pattern's bearish implication.
Trading Symmetrical Triangle Patterns in the Indian Market
Effectively trading symmetrical triangle patterns in the Indian stock market requires a systematic approach. Here are some key considerations:
-
Entry and Exit Points: When a symmetrical triangle pattern forms, traders can anticipate a significant price move. Consider long positions if the price breaks out to the upside and short positions if it breaks out to the downside.
-
Volume Confirmation: Pay attention to trading volume when the price breaks out of the triangle pattern. A breakout with significant volume is a stronger signal.
-
Price Targets: To estimate potential price targets, measure the height of the triangle and project it in the direction of the breakout.
-
Stop-Loss Orders: Implement stop-loss orders to manage risk. Place them just beyond the opposite side of the triangle pattern to protect against false breakouts.
-
Timeframes: Symmetrical triangle patterns can appear on various timeframes, so choose one that aligns with your trading strategy.
Conclusion
Symmetrical triangle patterns are valuable tools for traders in the Indian stock market. Recognizing these patterns, understanding their formation, and incorporating them with other technical analysis tools can enhance your trading decisions.
However, it's essential to remember that no pattern is foolproof, and risk management remains crucial in trading. Conduct thorough research and consider employing additional indicators and analysis methods to validate your trading decisions.
By mastering these patterns and combining them with a well-rounded trading strategy, you can navigate the Indian stock market with increased confidence and precision.