 Top Mutual Funds
- 31 Oct 2023
- ICICI Securities
-
Share
-

-

-

-

-

UNDERSTANDING CHARTING PATTERNS- THE CUP AND HANDLE
Understanding Charting patterns- The cup and handle
Introduction
Technical analysis plays a vital role in stock trading, helping investors and traders make informed decisions based on historical price data and chart patterns. One of the most recognized and widely used patterns is the "Cup and Handle." This pattern is particularly relevant in the Indian stock market, offering valuable insights for traders. In this blog, we will delve into the Cup and Handle pattern, using real-life Indian stock examples to illustrate its importance and practical applications.
What is the Cup and Handle Pattern?
The Cup and Handle pattern is a technical analysis pattern that resembles the shape of a teacup with a handle. It is a bullish continuation pattern, often found in an existing uptrend, suggesting that the stock's price is likely to continue rising after a brief consolidation phase. The pattern consists of the following components:
-
The Cup: The cup forms as the stock price experiences a gradual decline followed by a gradual rise. The decline phase can last several weeks to several months, while the subsequent rise forms the rounded bottom of the cup.
-
The Handle: Following the cup formation, there is typically a short-term consolidation or correction period known as the handle. The handle is characterized by a small pullback in the stock's price and is relatively shorter in duration compared to the cup.
-
Breakout Point: The breakout point is where the stock's price breaks above the resistance level formed by the top of the cup. This breakout signifies the potential for a significant upward movement.
Real-Life Examples from the Indian Stock Market
Let's explore a few real-life examples from the Indian stock market to understand the Cup and Handle pattern in action.
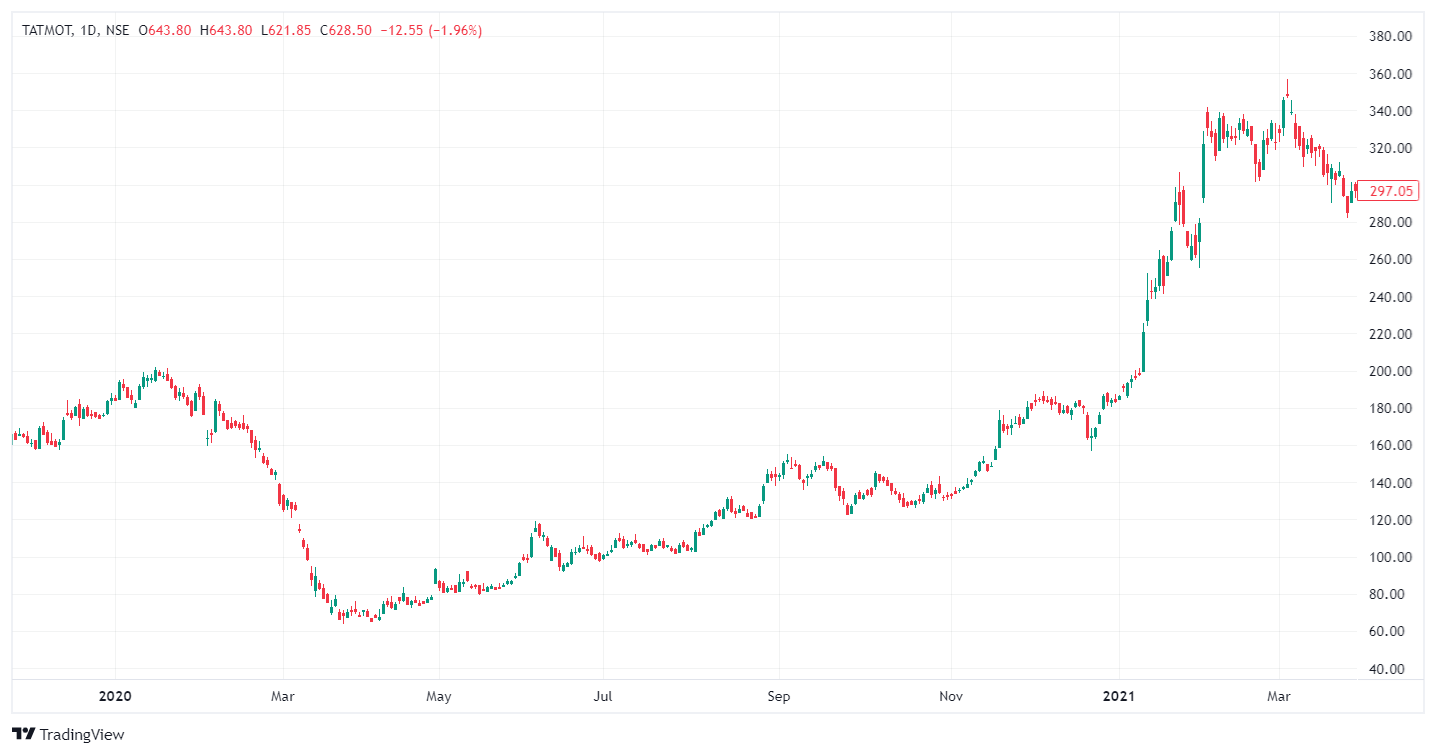
Example 1: Tata Motors Limited (TATAMOTORS)
Tata Motors, one of India's largest automotive companies, displayed a classic Cup and Handle pattern between 2020 and 2021. This example illustrates the pattern's formation and subsequent breakout.
Here's a breakdown of the key elements:
-
The Cup: The cup formation occurred between March 2020 and December 2020, with the stock price declining from approximately ₹60 to ₹100, followed by a gradual rise.
-
The Handle: The handle formation took place between December 2020 and March 2021, characterized by a short consolidation phase and a minor pullback in the stock's price.
-
Breakout Point: Tata Motors' stock broke out above the resistance level at around ₹200 in March 2021, indicating the potential for a bullish trend continuation. This breakout marked the beginning of a significant uptrend for the stock.
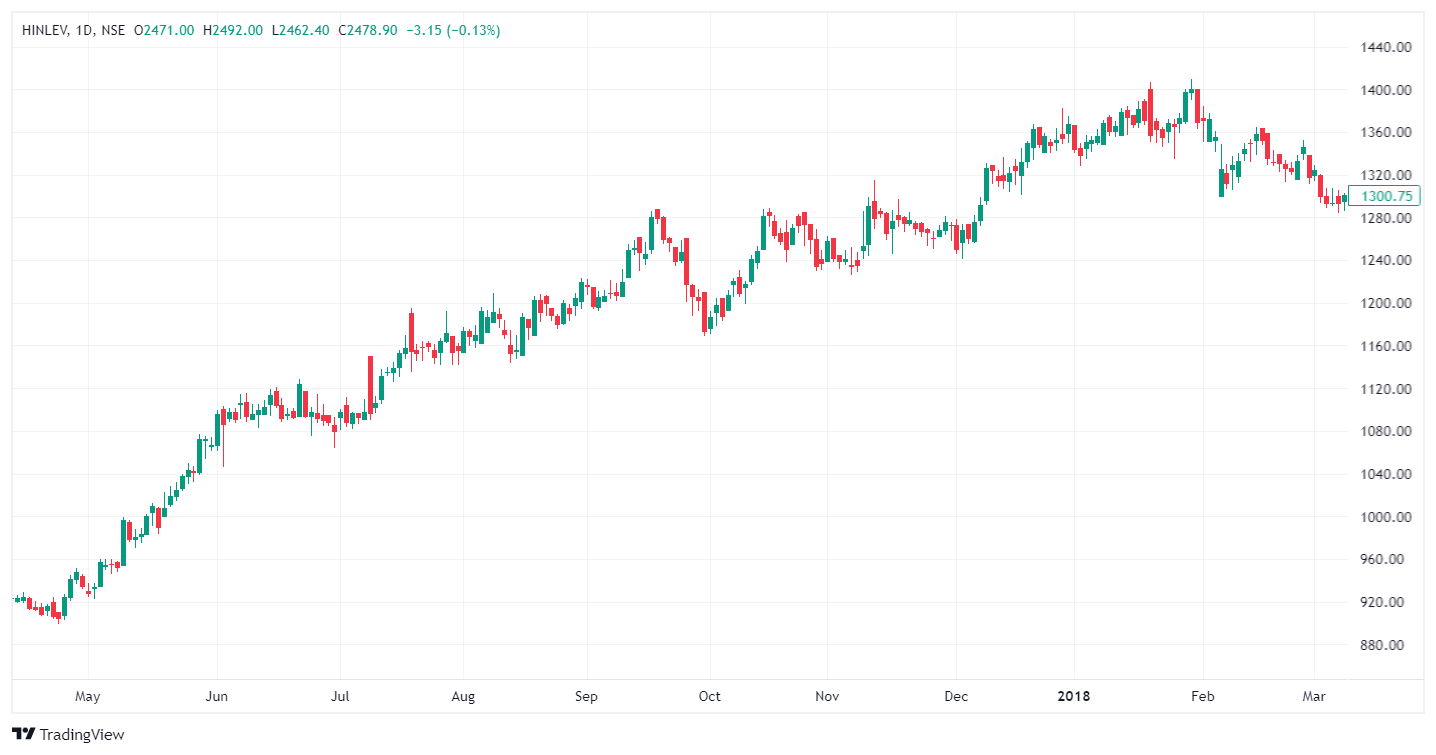
Example 2: Hindustan Unilever Limited (HINDUNILVR)
Hindustan Unilever, a prominent Indian consumer goods company, exhibited a Cup and Handle pattern in 2018. This example demonstrates the pattern's adaptability to various sectors within the Indian stock market.
Here's a breakdown of this example:
-
The Cup: The cup formation occurred between May 2017 and January 2018, with the stock price declining from approximately ₹1,200 to ₹1,000, followed by a gradual rise, forming the bottom of the cup.
-
The Handle: The handle formation was relatively short, taking place between January and March 2018, with a minor pullback in the stock's price.
-
Breakout Point: Hindustan Unilever's stock broke out above the resistance level at around ₹1,400 in March 2018, signaling the potential for a bullish trend continuation. The stock's price subsequently entered an uptrend.
Trading the Cup and Handle Pattern in the Indian Market
Identifying the Cup and Handle pattern is the first step, but knowing how to trade it effectively is crucial. Here are some key considerations when trading this pattern in the Indian stock market:
-
Entry Point: The ideal entry point for a Cup and Handle pattern is just above the breakout point. This minimizes the risk of entering the trade too early and getting caught in a false breakout.
-
Volume Confirmation: Pay close attention to trading volume. A breakout accompanied by above-average volume is a stronger signal than a breakout with low volume.
-
Price Targets: The depth of the cup can be used to estimate a price target for the pattern. Measure the vertical distance from the lowest point of the cup to the top of the handle and add it to the breakout point to estimate a potential price target.
-
Stop-Loss Orders: Implementing stop-loss orders is crucial to manage risk. Place your stop-loss slightly below the handle's low to protect your capital in case the pattern fails.
-
Timeframes: Cup and Handle patterns can appear on various timeframes, from intraday charts to weekly or monthly charts. Choose a timeframe that aligns with your trading strategy and goals.
Conclusion
The Cup and Handle pattern is a powerful tool for traders in the Indian stock market. By recognizing this pattern, understanding its components, and using it in conjunction with other technical analysis tools, you can increase your chances of making successful trades. However, it's important to remember that no pattern is foolproof, and risk management remains paramount in trading. Always conduct thorough research and consider using other indicators and analysis methods to confirm your trading decisions. The Indian stock market, with its diverse array of stocks and sectors, offers ample opportunities for traders to apply the Cup and Handle pattern for suitable trades.