 Top Mutual Funds
- 31 Oct 2023
- ICICI Securities
-
Share
-

-

-

-

-

UNDERSTANDING CHARTING PATTERNS- TRIANGLE SHAPES - ASCENDING AND DESCENDING
Understanding Charting patterns- Triangle Shapes - Ascending And Descending
Introduction
In the world of stock trading, technical analysis plays a crucial role in helping traders make informed decisions. Chart patterns are an integral part of technical analysis, and among them, the ascending and descending triangles are two significant formations. In this blog, we will explore these triangle patterns in depth, using real-life examples from the Indian stock market to illustrate their relevance.
Understanding Triangle Patterns
Triangle patterns are a subset of chart patterns that provide insights into potential price movements based on the shape of the pattern. There are two main types of triangle patterns:
-
Ascending Triangle: Ascending triangles typically occur within an uptrend and suggest that the price is likely to continue rising. They are characterized by a horizontal resistance level and an ascending support line.
-
Descending Triangle: Descending triangles, on the other hand, typically manifest within a downtrend and indicate that the price is likely to continue declining. They are characterized by a horizontal support level and a descending resistance line.
Let's explore real-life examples from the Indian stock market to gain a better understanding of both ascending and descending triangle patterns.
Ascending Triangle Example: Hindustan Unilever Limited (HINDUNILVR)
Hindustan Unilever, a prominent Indian consumer goods company, exhibited an Ascending Triangle pattern in 2020. This example illustrates how an Ascending Triangle pattern can signal a potential continuation of an uptrend.
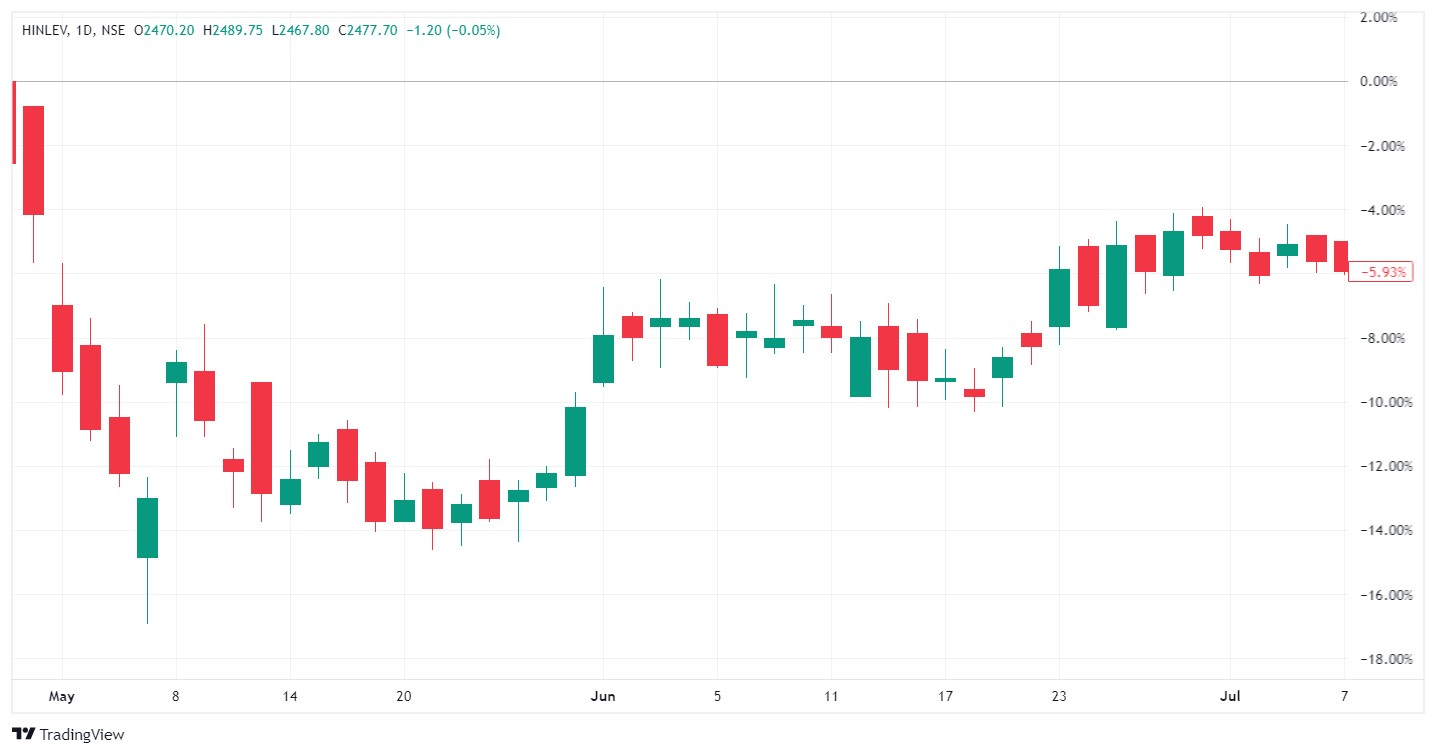
Here's a breakdown of the key elements:
-
Pattern Formation: The Ascending Triangle pattern formed from May to July 2020 within an existing uptrend. It was characterized by a horizontal resistance level and an ascending support line.
-
Signal Confirmation: As the stock's price approached the apex of the triangle, it broke out above the resistance level, confirming the bullish pattern. This signaled the potential for the uptrend to continue.
-
Subsequent Movement: Following the breakout, Hindustan Unilever's stock price continued its upward trajectory, aligning with the pattern's bullish implication.
Descending Triangle Example: Tata Steel Limited (TATASTEEL)
Tata Steel, a significant player in the Indian steel industry, displayed a Descending Triangle pattern in 2019. This example demonstrates how a Descending Triangle pattern can signal a potential continuation of a downtrend.
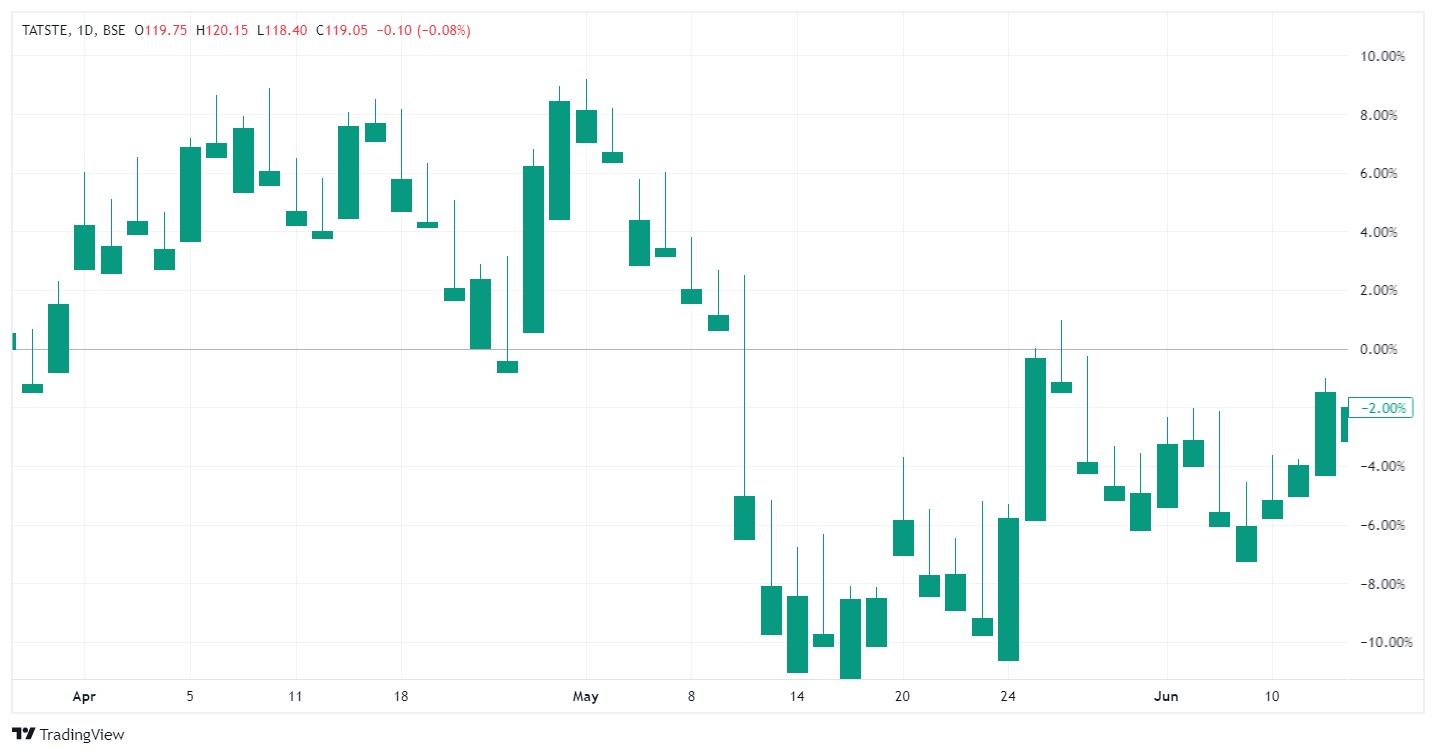
Here's a detailed analysis of this example:
-
Pattern Formation: The Descending Triangle pattern formed from April to June 2019 within a downtrend. It was characterized by a horizontal support level and a descending resistance line.
-
Signal Confirmation: As the stock's price approached the apex of the triangle, it broke out below the support level, confirming the bearish pattern. This signaled the potential for the downtrend to persist.
-
Subsequent Movement: Following the breakout, Tata Steel's stock price continued its downward trajectory, aligning with the pattern's bearish implication.
Trading Triangle Patterns in the Indian Market
Effectively trading triangle patterns in the Indian stock market requires a systematic approach. Here are some key considerations:
-
Entry and Exit Points: For Ascending Triangles, consider long positions when the price breaks out above the resistance level. For Descending Triangles, consider short positions when the price breaks out below the support level.
-
Volume Confirmation: Pay attention to trading volume when the price breaks out of the triangle pattern. A breakout with significant volume is a stronger signal.
-
Price Targets: To estimate potential price targets, measure the height of the triangle and project it in the direction of the breakout.
-
Stop-Loss Orders: Implement stop-loss orders to manage risk. Place them just beyond the opposite side of the triangle pattern to protect against false breakouts.
-
Timeframes: Triangle patterns can appear on various timeframes, so choose one that aligns with your trading strategy.
Conclusion
Triangle patterns, whether ascending or descending, are valuable tools for traders in the Indian stock market. Recognizing these patterns, understanding their formation, and incorporating them with other technical analysis tools can enhance your trading decisions.
However, it's essential to remember that no pattern is foolproof, and risk management remains crucial in trading. Conduct thorough research and consider employing additional indicators and analysis methods to validate your trading decisions.
By mastering these patterns and combining them with a well-rounded trading strategy, you can navigate the Indian stock market with increased confidence and precision.