UNLEASHING THE POWER OF AVERAGE TRUE RANGE: A TECHNICAL INDICATOR FOR SMART TRADERS
Unleashing the Power of Average True Range: A Technical Indicator for Smart Traders
Introduction
In the dynamic world of financial markets, understanding and utilizing technical indicators is crucial for traders seeking to make informed decisions. One such indicator that has gained significant popularity among traders is the Average True Range (ATR). Developed by J. Welles Wilder Jr., the ATR is a versatile tool that measures market volatility, identifies potential price trends, and aids in risk management. In this blog post, we will delve into the concept of ATR, explore its calculation method, and highlight its practical applications for traders.
Understanding the Average True Range (ATR)
The Average True Range (ATR) is a technical indicator used to measure the volatility of a financial instrument, such as stocks, commodities, or currencies. Unlike other indicators that focus solely on price movements, the ATR considers the range between the high and low prices, taking into account gaps and price gaps.

Calculation Method
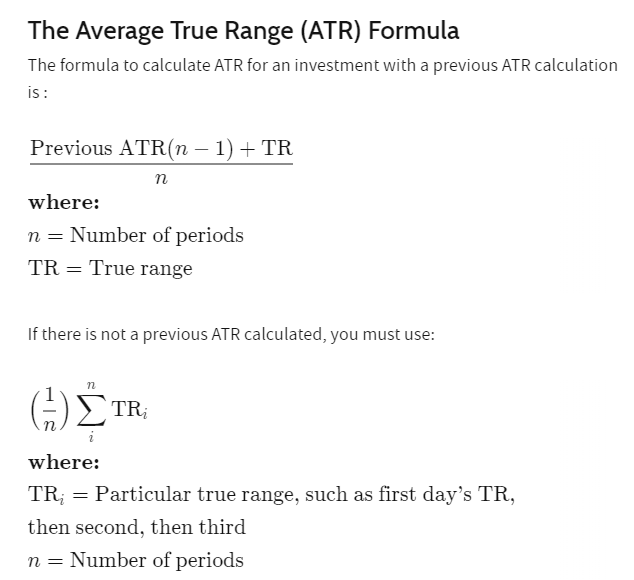
The ATR is calculated using a straightforward and iterative process. Here are the steps involved:
1. Calculate the True Range (TR): The True Range represents the greatest of the following three values:
- Current high minus the current low
- Absolute value of the current high minus the previous close
- Absolute value of the current low minus the previous close
2. Smooth the True Range: The TR values are smoothed using a moving average over a specified period. The most common smoothing period is 14 days.
3. Calculate the Average True Range: The Average True Range is computed by applying another moving average to the smoothed True Range values obtained in step 2. This moving average is also calculated over a specified period, typically 14 days.
Example:
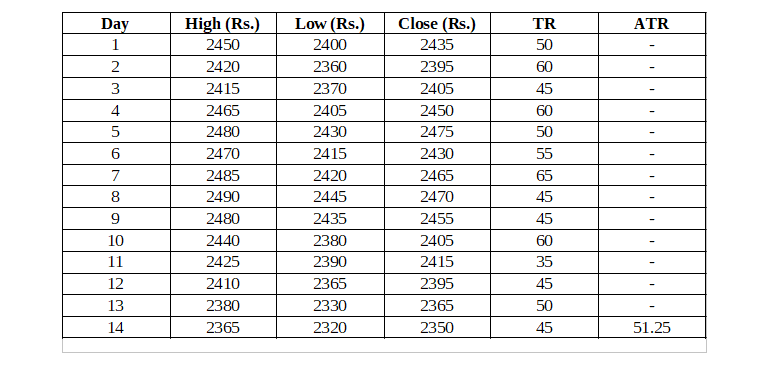
Let's take a real-life example of Hindustan Unilever Limited (HINDUNILVR) and use the Average True Range (ATR) indicator to explain changes in position in a tabular format.
Assume we are analyzing HINDUNILVR's daily price movements over a period of 14 days. Here's a simplified example of HINDUNILVR's price data along with the True Range (TR) and ATR calculations:

Now, let's use the ATR indicator to analyze the changes in position:
Step 1: Calculate the Average True Range (ATR)
The ATR is calculated by taking the average of the True Range (TR) values over the specified period. Let's assume we are using a 14-day ATR period.
ATR on Day 14 = (Sum of TR for Days 1 to 14) / 14
ATR on Day 14 = (50 + 60 + 45 + 60 + 50 + 55 + 65 + 45 + 45 + 60 + 35 + 45 + 50) / 14
ATR on Day 14 = 51.25
Step 2: Analyze the Changes in Position
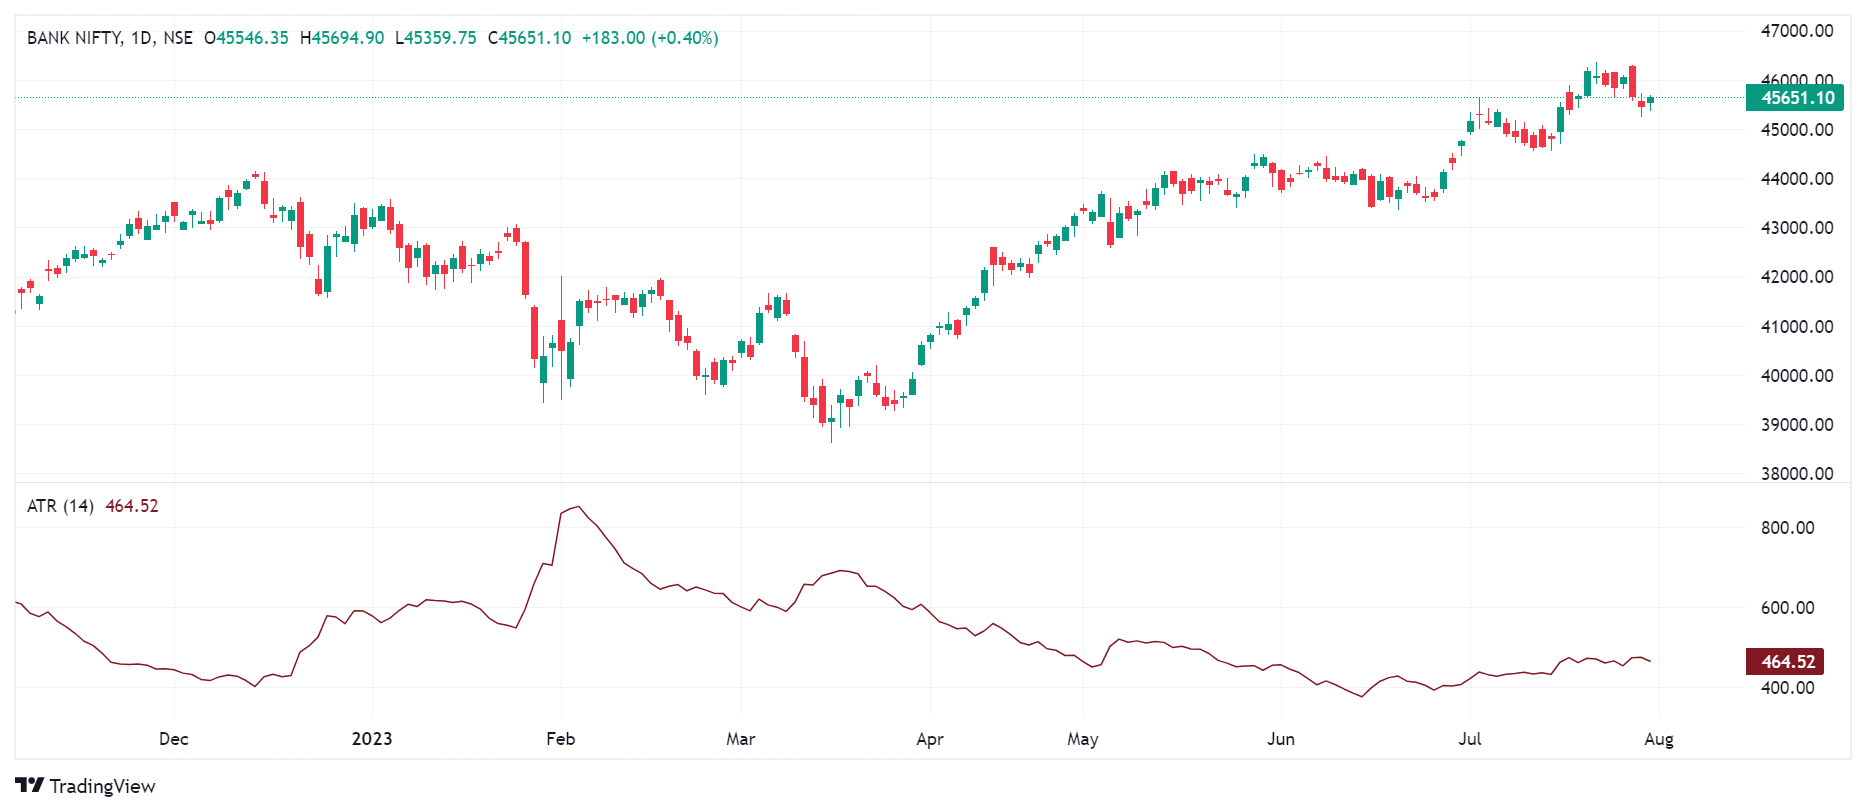
- When the ATR value is low, it suggests that the stock is experiencing low volatility. Traders may expect narrow price movements during such periods.
- When the ATR value is high, it indicates that the stock is experiencing high volatility. Traders may expect wider price swings and potentially larger moves during such periods.
- A significant increase in the ATR value compared to previous days may indicate a sudden surge in volatility and may signal potential trend changes or breakout opportunities.
- A decreasing ATR value compared to previous days may indicate reduced volatility and potential consolidation or sideways movement.

Practical Applications of ATR
1. Volatility Assessment: ATR provides a reliable measure of market volatility, allowing traders to gauge whether a market is experiencing high or low volatility. By comparing the ATR values across different time periods, traders can identify periods of increased or decreased price volatility, enabling them to adjust their trading strategies accordingly.
2. Trend Identification: ATR can be used to identify potential trends in the market. When the ATR value is rising, it indicates an increase in volatility, often associated with a strong price trend. Conversely, a declining ATR suggests a decrease in volatility, which may signify a consolidating or ranging market.
3. Setting Stop Loss and Take Profit Levels: ATR assists traders in setting appropriate stop loss and take profit levels. By incorporating ATR into their risk management strategy, traders can place stop loss orders outside the range of the ATR, ensuring they give their trades enough room to breathe while protecting themselves from excessive risk.
4. Position Sizing: ATR can also be used to determine position sizes based on the level of market volatility. Higher ATR values may warrant smaller position sizes to account for increased potential price swings, while lower ATR values may allow for larger positions with tighter stop losses.
5. Filter for Breakout Strategies: Traders utilizing breakout strategies can use ATR to filter potential breakouts. By comparing the current price range to the recent ATR values, traders can identify breakouts that exceed the average range, signaling a potentially significant price move.
Conclusion
The Average True Range (ATR) is a powerful technical indicator that provides traders with valuable insights into market volatility, trend identification, risk management, and position sizing. By incorporating ATR into their trading strategies, traders can make more informed decisions and enhance their overall profitability. It is important to note that ATR should not be used in isolation but in conjunction with other indicators and analysis tools to build a comprehensive trading approach. As with any technical indicator, it is recommended to thoroughly backtest and validate its effectiveness before implementing it in live trading.
Disclaimer: ICICI Securities Ltd. ( I-Sec). Registered office of I-Sec is at ICICI Securities Ltd. - ICICI Venture House, Appasaheb Marathe Marg, Prabhadevi, Mumbai - 400 025, India, Tel No : 022 - 6807 7100. I-Sec is a Member of National Stock Exchange of India Ltd (Member Code :07730), BSE Ltd (Member Code :103) and Member of Multi Commodity Exchange of India Ltd. ( Member Code : 56250) and having SEBI registration no. INZ000183631. Name of the Compliance officer (broking): Ms. Mamta Shetty, Contact number: 022-40701000, E-mail address: complianceofficer@icicisecurities.com. Investments in securities market are subject to market risks, read all the related documents carefully before investing. The contents herein above shall not be considered as an invitation or persuasion to trade or invest. I-Sec and affiliates accept no liabilities for any loss or damage of any kind arising out of any actions taken in reliance thereon. Investors should consult their financial advisers whether the product is suitable for them before taking any decision. The client shall not have any claim against I-Sec and/or its employees on account of any suspension, interruption, non-availability or malfunctioning of I-Sec system or service or non-execution of algo orders due to any link/system failure for any reason beyond I-Sec control. I-Sec reserves the right to pause, stop or call back any of the execution algos in case of any technical or mechanical exigency.
 Top Mutual Funds
