UNVEILING THE SIGNIFICANCE OF BOLLINGER BANDS IN THE STOCK MARKET
Successful trading in the stock market requires a deep understanding of technical indicators that can provide valuable insights into market trends and potential price movements. Among the wide array of indicators available, Bollinger Bands have gained significant popularity among traders. Bollinger Bands are a versatile tool that helps identify volatility, spot potential price reversals, and determine optimal entry and exit points. In this blog post, we will delve into the importance of Bollinger Bands as a technical indicator in the stock market.
Understanding Bollinger Bands
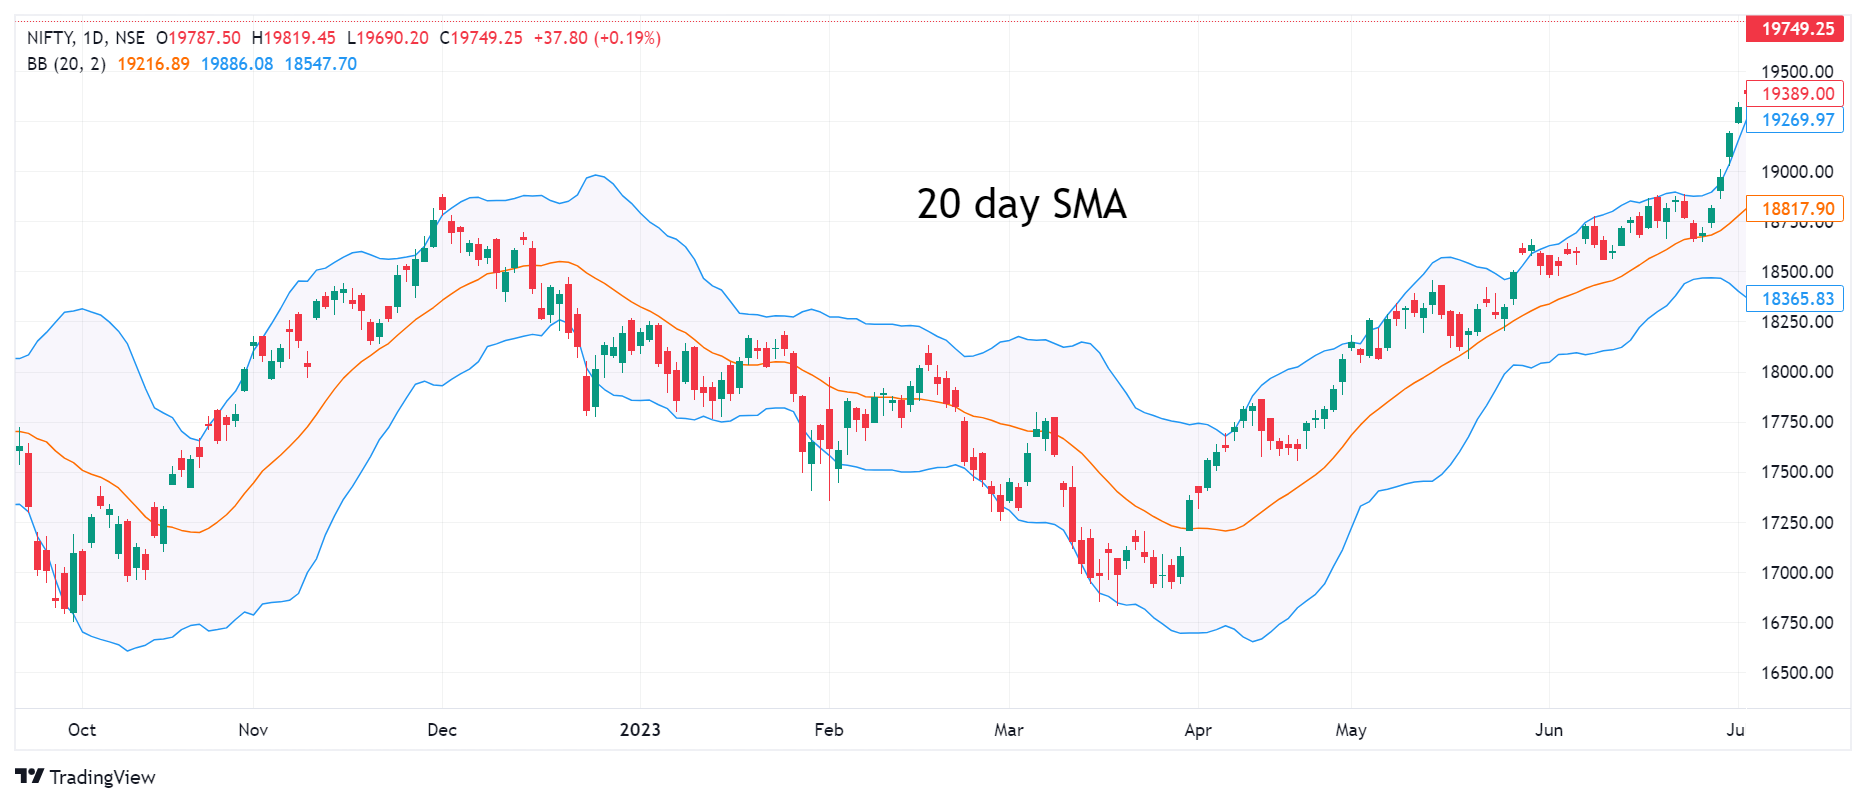
Bollinger Bands consist of three lines plotted on a price chart: the middle band, the upper band, and the lower band. The middle band is typically a 20-day simple moving average (SMA), representing the average price over the specified period. The upper and lower bands are positioned above and below the middle band, typically two standard deviations away from it. The width of the Bollinger Bands fluctuates with market volatility, expanding during periods of high volatility and contracting during periods of low volatility.

How Bollinger Bands can be useful for traders
1.Volatility Measurement
Bollinger Bands play a crucial role in measuring market volatility. When the bands are wide, it indicates higher volatility, suggesting larger price swings and potential trading opportunities. Conversely, when the bands are narrow, it indicates lower volatility, implying smaller price movements and a potential period of consolidation. Traders can use the width of the bands to gauge market conditions and adjust their trading strategies accordingly. During high volatility, traders may consider more aggressive trading approaches, while during low volatility, they may adopt more conservative strategies.
2. Spotting Overbought and Oversold Conditions
Bollinger Bands are also effective in identifying overbought and oversold conditions in the market. When the price reaches the upper band, it suggests the market is overbought, indicating a potential reversal or correction. Conversely, when the price reaches the lower band, it suggests the market is oversold, signaling a potential buying opportunity. Traders can utilize these indications to make informed decisions regarding when to enter or exit trades, potentially maximizing profits and managing risk effectively.
3. Reversal Signals
Bollinger Bands provide valuable signals for potential price reversals. When the price touches or penetrates the upper band, followed by a reversal and subsequent move towards the lower band, it may indicate a bearish reversal. Conversely, when the price touches or penetrates the lower band, followed by a reversal and subsequent move towards the upper band, it may suggest a bullish reversal. These reversal signals assist traders in identifying potential turning points in the market and adjusting their trading strategies accordingly.
4. Squeeze Patterns
Bollinger Bands are also known for their ability to detect squeeze patterns. A squeeze occurs when the bands narrow significantly, indicating a period of low volatility and a potential impending breakout. Traders closely monitor squeeze patterns as they can signal an imminent surge in price movement. Once the price breaks out of the squeeze, traders may consider entering positions in the direction of the breakout, capitalizing on the potential price momentum.
5. Confirmation with Other Indicators
Bollinger Bands are often used in conjunction with other technical indicators to validate signals and enhance trading strategies. Traders may combine Bollinger Bands with oscillators such as the Relative Strength Index (RSI) or Moving Average Convergence Divergence (MACD) to confirm buy or sell signals. This comprehensive approach helps traders make more informed decisions by considering multiple indicators and increasing the reliability of their trading signals.
Conclusion
Bollinger Bands are a versatile technical indicator that provides valuable insights into market volatility, overbought and oversold conditions, potential reversals, and squeeze patterns. By incorporating Bollinger Bands into their analysis, traders can make more informed decisions, improve market timing, and identify profitable trading opportunities. However, like any technical indicator, Bollinger Bands should be used in conjunction with other analysis tools and risk management strategies to enhance trading effectiveness and minimize potential risks.
Disclaimer: ICICI Securities Ltd. ( I-Sec). Registered office of I-Sec is at ICICI Securities Ltd. - ICICI Venture House, Appasaheb Marathe Marg, Prabhadevi, Mumbai - 400 025, India, Tel No : 022 - 6807 7100. I-Sec is a Member of National Stock Exchange of India Ltd (Member Code :07730), BSE Ltd (Member Code :103) and Member of Multi Commodity Exchange of India Ltd. ( Member Code : 56250) and having SEBI registration no. INZ000183631. Name of the Compliance officer (broking): Ms. Mamta Shetty, Contact number: 022-40701000, E-mail address: complianceofficer@icicisecurities.com. Investments in securities market are subject to market risks, read all the related documents carefully before investing. The contents herein above shall not be considered as an invitation or persuasion to trade or invest. I-Sec and affiliates accept no liabilities for any loss or damage of any kind arising out of any actions taken in reliance thereon. Investors should consult their financial advisers whether the product is suitable for them before taking any decision. The client shall not have any claim against I-Sec and/or its employees on account of any suspension, interruption, non-availability or malfunctioning of I-Sec system or service or non-execution of algo orders due to any link/system failure for any reason beyond I-Sec control. I-Sec reserves the right to pause, stop or call back any of the execution algos in case of any technical or mechanical exigency.
 Top Mutual Funds
