Top Mutual Funds
- 20 Mar 2023
- ICICIdirect
- 9 minutes
-
Share
-

-

-

-

-

WHAT IS MOVING AVERAGES AND HOW DOES IT HELP IN TECHNICAL ANALYSIS
The moving average is one of the oldest tools used by technical analysts. The price of a stock often fluctuates and can create a lot of noise for an analyst. The moving averages helps to eliminate the noise and gives a smooth data set for an analyst to take better trade decision.
Types of Moving Averages
- Simple moving average (SMA)
- Exponential moving average (EMA)
Simple moving Average (SMA)
The most used simple moving average is the 20day, 50day, 100day and 200day moving average respectively
To calculate the moving averages, we take the average of the closing price for those number of days. For example, a 20day simple moving average is nothing but the arithmetic mean of the 20 day closing price of the stock, similarly for 50day, 100 day and 200 day respectively.
Let us consider and calculate the moving average of last 5 days of Nifty50
|
Date |
Closing Price |
|
17/02/2023 |
17,944.20 |
|
20/02/2023 |
17,844.60 |
|
21/02/2023 |
17,826.70 |
|
22/02/2023 |
17,554.30 |
|
23/02/2023 |
17,511.25 |
Price total = 17,944.20+17,844.60+17,826.70+17,554.30+17,511.25 = 88,681.05
5 day average = 88,681.05/5 = 17,736.21
Hence the moving average of Nifty50 in last 5 session is 17,736.21
Going ahead the next 5 day average for Nifty50 will be taken from the next trading session i.e 20/02/2023 to 24/02/2023
Example,
|
Date |
Price |
5 day Moving Average |
|
01/27/23 |
17,604.35 |
|
|
01/30/23 |
17,648.95 |
|
|
01/31/23 |
17,662.15 |
|
|
02/01/23 |
17,616.30 |
|
|
02/02/23 |
17,610.40 |
17,628.43 |
|
02/03/23 |
17,854.05 |
17,678.37 |
|
02/06/23 |
17,764.60 |
17,701.50 |
|
02/07/23 |
17,721.50 |
17,713.37 |
|
02/08/23 |
17,871.70 |
17,764.45 |
If you notice the average on 3nd February 2023 and 6th February are different. While calculating this number we are mainly moving to the latest data point hence the name “moving” average
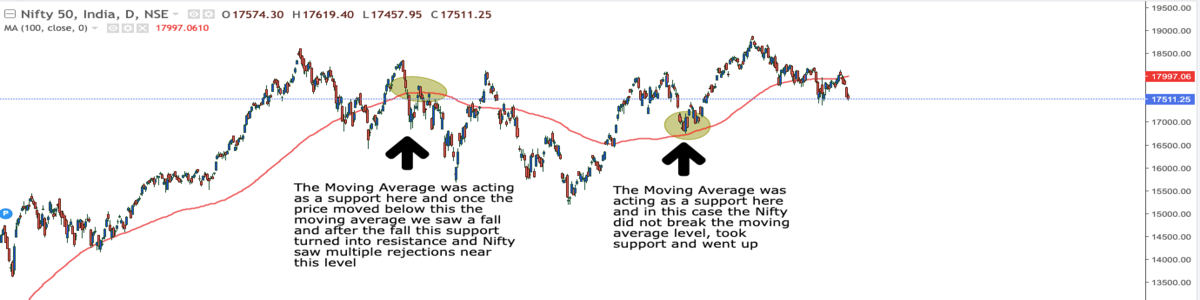
The moving averages are mainly used to determine support and resistance by the analyst. Let us understand this by example, we will be using 50, 100 and 200 day simple moving averages for now.
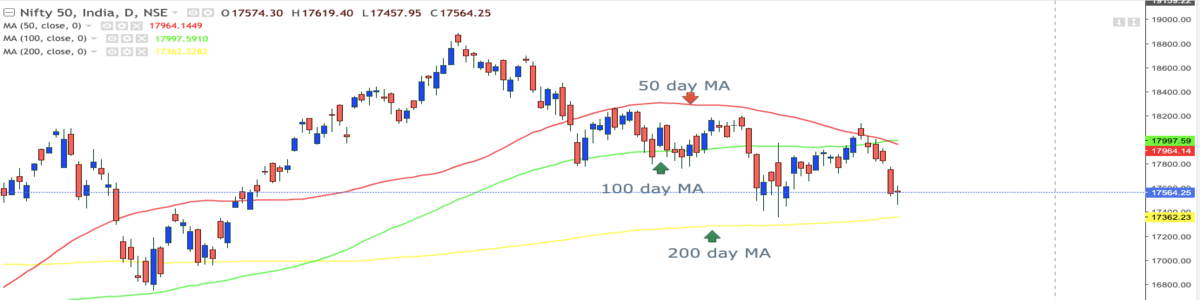
Whenever the price is below the moving average, the moving average acts as a resistance and whenever the price is above the moving average it will as act as a support. Let us understand this in a more simplified chart
Nifty50 Daily timeframe chart,
Consider multiple Moving average for Nifty50,
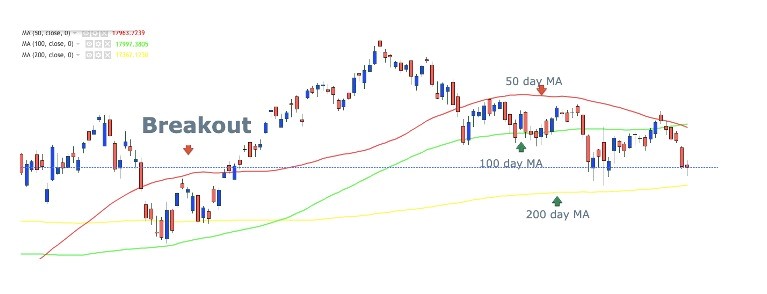
The price of the index has taken support and resistance at every moving average and a break on either side has resulted in a breakdown or breakout.
If you notice, Nifty50 gave a breakout once it crossed 50 day moving average after taking support at 200 day moving averages. Also going ahead, we can also see that 50 day moving average (red line) has provided crucial resistance which Nifty has not managed to cross.
Exponential Moving Average (EMA)
Exponential Moving Average (EMA) is similar to Simple Moving Average (SMA), measuring trend direction over a period of time. However, whereas SMA simply calculates an average of price data, EMA applies more weight to data that is more current. Because of its unique calculation, EMA will follow prices more closely than a corresponding SMA.
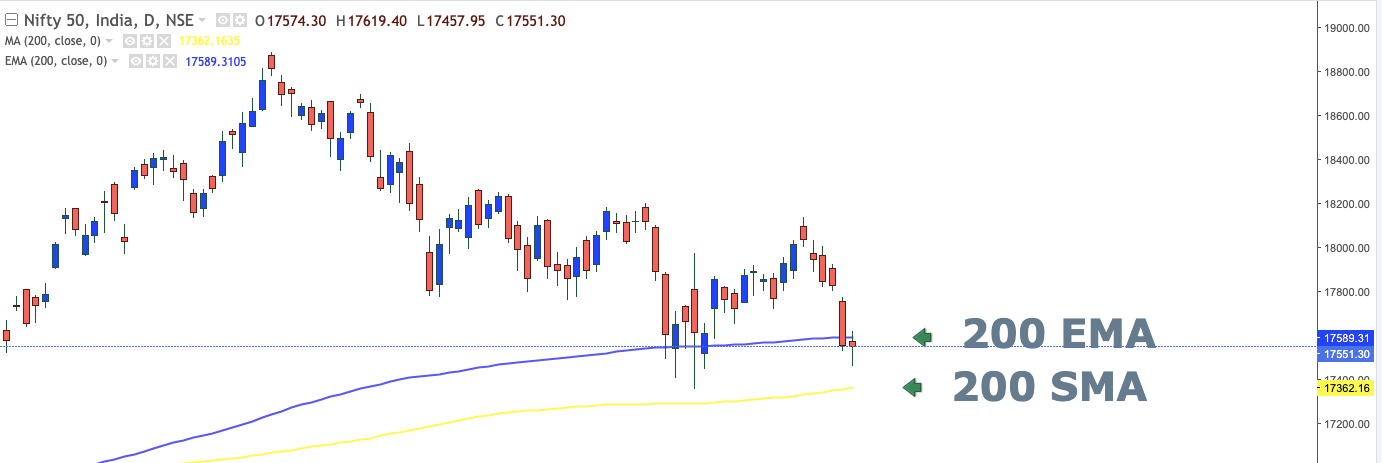
If you notice, the 200 EMA is closer to the Nifty price as compared to the 200SMA
The commonly used EMA by technical analysts are 5,9,21,50,100,200
The formula to compute the EMA is,
EMA = Weightcurrent X Data day i + Weightma X Moving Averageday i-1,
here Data Dayi is nothing but the closing price of the stock at that day.
Weightcurrent = 2/ (number of days in moving average + 1)
Weightma = 100% - Weightcurrent
So to calculate the 19 day EMA we use the following,
Weightcurrent = 2/(19+1) = 2/10 = 1/10 = 10%
Weightma = 100% - 10% = 90%
So after calculating the Weightcurrent & Weightma one can simple plug the values of Data Day I and Simple moving average of the day before to get the EMA value.
Moving Average crossover:
In this section we will be covering the crossover system for SMA and EMA respectively and how traders use this to take their trades
SMA crossover
- Golden crossover
- Death crossover
1. Golden crossover:
A Golden crossover is a technical analysis indicator that occurs when a short-term moving average (50-day moving average) crosses above a long-term moving average (200-day moving average). This is considered a bullish signal, suggesting that the stock or market is trending upward. If the 50-day moving average crosses above the 200-day moving average, it could indicate a potential upward trend in the market. This could encourage investors to buy stocks and drive-up prices.
For example, consider NIFTY50 chart (August 2020),
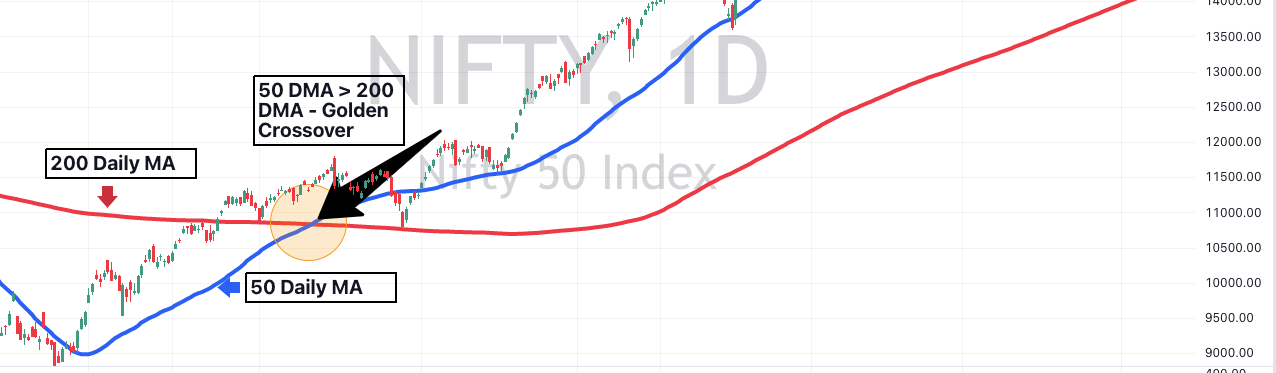
We could look at the 50-day and 200-day moving averages of the Sensex and watch for a golden crossover. Since August 2020, due to this crossover Nifty50 had entered a bullish trend which had lasted for over 1 year time period
One can use these two indicators for any index/stock and check.
2. Death Crossover:
A Death crossover is a technical analysis indicator that occurs when a short-term moving average (50-day moving average) crosses below a long-term moving average (200-day moving average). This is considered a bearish signal, suggesting that the stock or market is trending downward. If the 50-day moving average crosses below the 200-day moving average, it could indicate a potential downward trend in the market. This could discourage investors from buying stocks and lead to a decrease in prices.
For example, consider NIFTY50 chart (March 2020 – Covid Fall),
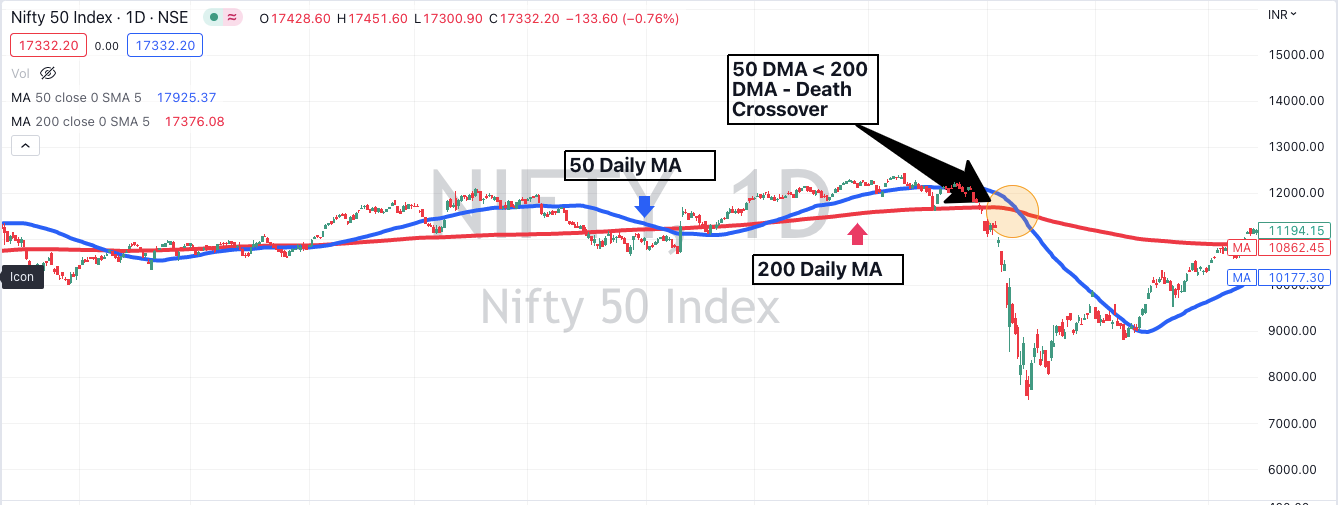
We all have seen the famous COVID fall where the index had lost more than ~40% of the value.
Exponential moving average crossovers:
The EMA crossovers are mainly used by the traders, the EMA crossover indicate a short-term change in there compared to the SMA which indicate a longer trend.
The commonly used EMA crossover combination are:
- 9 & 21 EMA – (Trader favorite, used for a few trading session)
- 25 & 50 EMA – (Used for a few weeks)
- 100 & 200 EMA – (Positional for a few months)
For example:
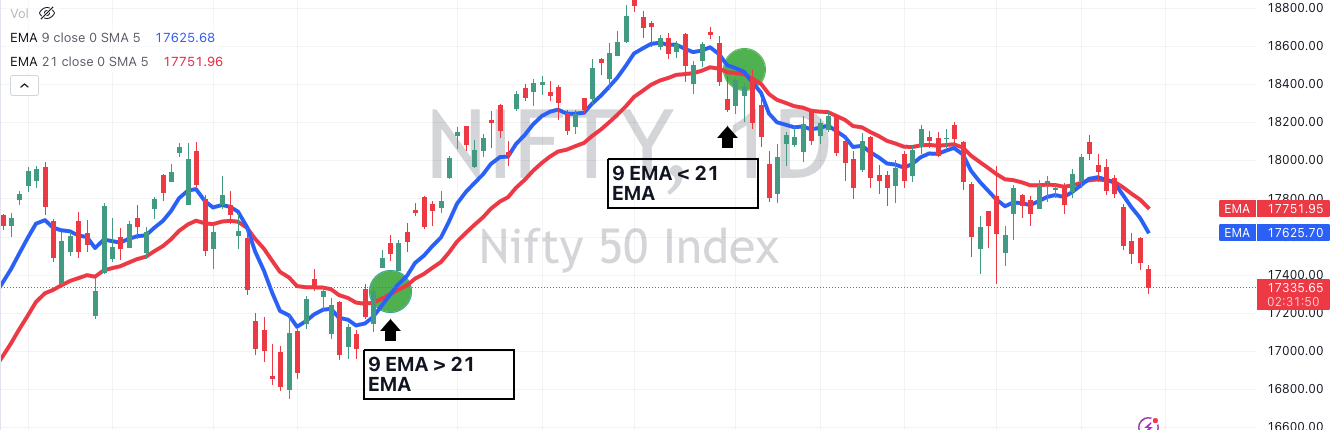
Consider the above example,
In the first instance the 9ema is breaching the 21 ema indicating a positive crossover, this is the point where a trader decides to build a bullish position and one should ideally hold onto his/her position until the price doesn’t give a close below 21 ema (i.e Stoploss).
Similarly in the second instance, the 9ema is below 21ema indicating a negative crossover, this is the point where a trader will build a bearish position and again one should ideally hold onto his/her position until the price doesn’t close above 21ema (i.e Stoploss)
EMA is a very powerful tool when it comes to trading and specially F&O trading.
Key Snapshot from this module:
- Simple moving average (SMA) powerful tool for a positional trader
- Exponential moving average (EMA) powerful tool for a short-term trader
- For SMA, most powerful averages are 50, 100 & 200 moving averages
- For EMA, most powerful averages are 9, 21, 50, 100 and 200
- For SMA, plot 50, 100, 200 MA on the chart and use them to build your trading position and use crossovers for long-term trend identification
For EMA, plot 9ema and 21ema and build your position as a short-term trader
Disclaimer: ICICI Securities Ltd. (I-Sec). Registered office of I-Sec is at ICICI Securities Ltd. - ICICI Venture House, Appasaheb Marathe Marg, Prabhadevi, Mumbai - 400 025, India, Tel No : 022 - 6807 7100. I-Sec is a Member of National Stock Exchange of India Ltd (Member Code :07730), BSE Ltd (Member Code :103) and Member of Multi Commodity Exchange of India Ltd. (Member Code: 56250) and having SEBI registration no. INZ000183631. I-Sec is a SEBI registered with SEBI as a Research Analyst vide registration no. INH000000990. Name of the Compliance officer (broking): Ms. Mamta Shetty, Contact number: 022-40701022, E-mail address: complianceofficer@icicisecurities.com. Investments in securities markets are subject to market risks, read all the related documents carefully before investing. The contents herein above shall not be considered as an invitation or persuasion to trade or invest. I-Sec and affiliates accept no liabilities for any loss or damage of any kind arising out of any actions taken in reliance thereon. Such representations are not indicative of future results. The non-broking products / services like Research, etc. are not exchange traded products / services and all disputes with respect to such activities would not have access to Exchange investor redressal or Arbitration mechanism. The contents herein above are solely for informational purpose and may not be used or considered as an offer document or solicitation of offer to buy or sell or subscribe for securities or other financial instruments or any other product. Investors should consult their financial advisers whether the product is suitable for them before taking any decision. The contents herein mentioned are solely for informational and educational purpose.