Learning Modules Hide
Hide
- Chapter 1: A Stock Market Guide on Equity Investment
- Chapter 2: Risk & Return on Equity Investment
- Chapter 3: Learn the Basics of Stock Market Participants and Regulators
- Chapter 4: How Does the Stock Market Work?
- Chapter 5: Guide to stock market trading
- Chapter 6: Stock market investment- Part 1
- Chapter 7: Stock market investment- Part 2
- Chapter 8: What are stock market indices?
- Chapter 9: How to Calculate the Stock Exchange Index: A Stock Market Course for Beginners
- Chapter 10: IPO investing basics
- Chapter 11: Types of IPO Investors in Stock Market
- Chapter 12: IPO Process- From Merchant Banker to Company Listing
- Chapter 13: IPO investment and FPO
- Chapter 14: Important things and Advantages of IPO Investment
- Chapter 15: Corporate Actions: Meaning, Types & Examples
- Chapter 16: Bonus Issue and Rights Issue
- Chapter 17: Corporate Action Purpose and Participation Method
- Chapter 1: Stock Valuation Terms Explained – Part 1
- Chapter 2: Stock Market Valuation- Important Ratios and Terms
- Chapter 3: Types of Stocks in Share Market- Part 1
- Chapter 4 –Types of Stocks in Share Market- Part 2
- Chapter 5: Taxation on Stock Investments – Part 1
- Chapter 6 – Taxation on Stock Investments – Part 2
- Chapter 7 - Difference Between Micro & Macro Economics
- Chapter 8 – Inflation and its Impact on the Economy
- Chapter 9 - Introduction to Economic Policies – Part 1
- Chapter 10 – Introduction to Economic Policies – Part 2
- Chapter 11 – GDP and the Government Budget
- Chapter 12 - How Foreign Investments Influence Business Cycles
- Chapter 13 - Economic Indicators
- Chapter 14 - Behavioural Biases and Common Pitfalls in Investment – Part 1
- Chapter 15 - Behavioural Biases and Common Pitfalls in Investment – Part 2
- Chapter 16 - Behavioural Biases and Common Pitfalls in Investment – Part 3
Chapter 1: Stock Valuation Terms Explained – Part 1
You cannot predict how stocks will perform in the future. So, what’s the point of analysing it?”
It’s true. You cannot predict the future. But you’re a stickler for due diligence! And you’ve never blindly entered into anything without doing your bit of research.
Let’s say you plan to go on a weekend trip with your family.
You cannot predict what the weather will be like. But checking the destination's weather forecast gives you an inkling of the kind of clothing you would need to pack to avoid unpleasant surprises.
That sorts out the weather bit.
Now, you wonder about the road traffic you might encounter. But there’s a handy assistant in Google Maps to help you get a good idea before starting your journey.
Similarly, researching and analysing stocks you’re planning to buy can give you a peek into what you can expect in the future.
So, how do you make this analysis?
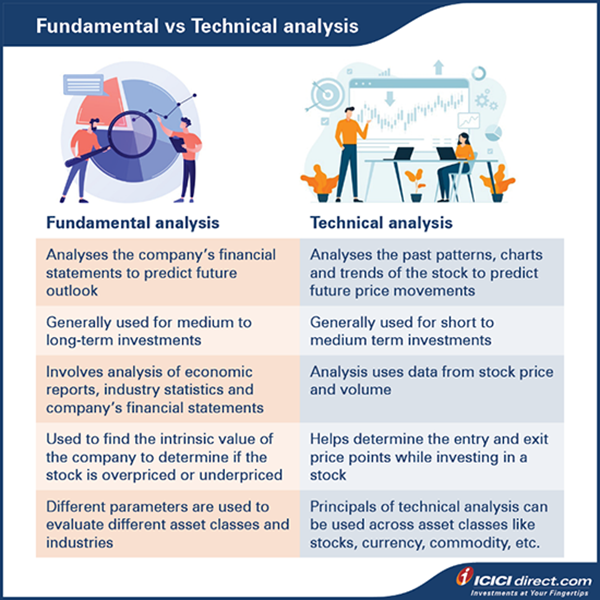
Well, there are two common ways of doing so - Fundamental Analysis and Technical Analysis.
Fundamental Analysis is used to calculate the intrinsic value of a stock based on the company's financials, macro-economic factors and sector outlook. Investors use this form of research when planning long-term investments.
For example:
In 2020, soon after the COVID-19 outbreak, investors were advised not to invest in automobile companies as the demand and supply in the industry seemed to be on a downhill.
On the other hand, Technical Analysis is a method of evaluating securities by analysing statistics generated by market activity, such as past prices and volume.
It does not attempt to measure a security's intrinsic value, but instead uses charts, trend lines and other tools to identify patterns that can suggest future activity. Usually, it is used to predict short-term investment outlooks.
For example:
Say, the stock price of Company A was on an uphill for the past few days. But today, Company A has started to spiral downward. You anticipate the price is likely to go down further. Although it may just be for the short term, this form of analysis helps you understand the company’s stock price pattern to ensure you make sound investment decisions.

Now, that we have understood the why and how to evaluate a stock. Let’s look at how to assess a company before investing in it.
1. Market Capitalization
When you visit your favourite café – Starbucks for a stimulating mug of hot brew, you receive three options.
- Tall, the smallest option
- Grande, the medium one
- Venti, the large one
So, why not have such exclusivity in your options as well when it comes to your investment needs?
This is where Market Capitalization comes in.
Market Capitalization is the valuation of a company based on the current market price of the company stock and the total number of outstanding shares. Where outstanding shares refers to the number of shares that are traded in the secondary market i.e. the shares that are available to the investors.
You can calculate it as follows:
Market Capitalization = Market price X Number of outstanding shares
For example:
If the stock of True Ventures Ltd is priced at Rs. 150, and the company has 50 lakh outstanding shares, then the market Capitalization of True Ventures Ltd would be 150*50,00,000 = Rs. 75 crore.
Based on market Capitalization, stocks can be categorized as large cap, mid cap and small cap companies.
As per SEBI guidelines, the first 100 stocks in terms of market Capitalization are large cap stocks, the subsequent 101-250 stocks are mid cap and the ones that fall below 251 onward are small cap stocks.
- Large cap companies – These companies that are market leaders in their segment and have the potential to stay on the top. This makes these companies more stable than the rest. They are also known as ‘blue chip stocks.’ Stocks like TCS, HDFC, ICICI bank, L&T, etc., are considered blue chip stocks.
- Mid cap companies – These are companies that are stepping into large cap shoes, meaning they have a potential to grow but are considered less stable than large cap companies.
- Small cap companies – These are companies that have very high potential to grow but comparatively carry more risks.

Here’s a basic comparison:
|
Parameter |
Large cap |
Mid cap |
Small cap |
|
Risk |
Low |
Moderate |
High |
|
Potential Returns |
Steady & Moderate |
High |
Very High |
But how should you choose which one to invest in?
Large cap stocks can be an ideal choice for risk-averse investors looking for steady returns on their investment. Aggressive investors may want to invest in mid and small cap stocks.

2. EPS (Earnings per share)
Earnings per share is the profit earned per outstanding share. Profit used here is the net of the dividend paid on the preferred shares and excludes any extraordinary item's impact. Extraordinary items are non-recurring in nature. For example, the company earns money via selling the land bank this year, but that is not a usual business and may not happen regularly.
So, how does one calculate the EPS of these companies?
You can calculate it as follows:
EPS = Net profit – Preference share dividend (+/-) Extraordinary items / Number of outstanding shares
Let’s say you have two automobile companies – Company A and Company B.
Let's say Company A has reported a profit of 10 crore with 1 crore outstanding shares whereas Company B also reported a profit of 10 crore but the total outstanding shares of company B is 2 crore. Assume this profit is adjusted for preference share dividend and extraordinary items.
So, the earning per share would be –
|
|
Company A |
Company B |
|
Net Profit (Rs.) |
10 crore |
10 crore |
|
Total Shares |
1 crore |
2 crore |
|
EPS (Rs.) |
10 |
5 |
But does that mean that companies with higher EPS are good for investments?
No, it does not. You will still need to compare the price of the share to its earnings and with a peer group of companies.
Usually, stocks with high-EPS and high EPS-growth-rate command premium pricing in the market.
Here’s where P/E (Price to earnings) ratio helps us determine the quality of stock, which we will learn about in the next chapter.
Also Read: Why is knowledge essential before starting on your equity investment journey
Summary
- Researching and analysing stocks you’re planning to buy can give you a peek into what you can expect in the future.
- Fundamental analysis is used to calculate the intrinsic value of a stock based on the company’s financials, macro-economic factors and sector outlook.
- Technical analysis is a method of evaluating securities by analysing statistics generated by market activity, such as past prices and volume.
- Market Capitalization is the valuation of a company based on the current market price of the company stock and the total number of outstanding shares.
- Earnings per share is the profit earned per outstanding share.
That’s not all. There are more stock valuation terms coming up in the next chapter.
Disclaimer: ICICI Securities Ltd. (I-Sec). Registered office of I-Sec is at ICICI Securities Ltd. - ICICI Venture House, Appasaheb Marathe Marg, Prabhadevi, Mumbai - 400 025, India, Tel No : 022 - 6807 7100. I-Sec is a Member of National Stock Exchange of India Ltd (Member Code :07730), BSE Ltd (Member Code :103) and Member of Multi Commodity Exchange of India Ltd. (Member Code: 56250) and having SEBI registration no. INZ000183631. Name of the Compliance officer (broking): Mr. Anoop Goyal, Contact number: 022-40701000, E-mail address: complianceofficer@icicisecurities.com. Investment in securities market are subject to market risks, read all the related documents carefully before investing. The contents herein above shall not be considered as an invitation or persuasion to trade or invest. I-Sec and affiliates accept no liabilities for any loss or damage of any kind arising out of any actions taken in reliance thereon. The contents herein above are solely for informational purpose and may not be used or considered as an offer document or solicitation of offer to buy or sell or subscribe for securities or other financial instruments or any other product. Investors should consult their financial advisers whether the product is suitable for them before taking any decision. The contents herein mentioned are solely for informational and educational purpose.

Track your application


COMMENT (0)