


Learning Modules Hide
Hide
- Chapter 1: A Stock Market Guide on Equity Investment
- Chapter 2: Risk & Return on Equity Investment
- Chapter 3: Learn the Basics of Stock Market Participants and Regulators
- Chapter 4: How Does the Stock Market Work?
- Chapter 5: Guide to stock market trading
- Chapter 6: Stock market investment- Part 1
- Chapter 7: Stock market investment- Part 2
- Chapter 8: What are stock market indices?
- Chapter 9: How to Calculate the Stock Exchange Index: A Stock Market Course for Beginners
- Chapter 10: IPO investing basics
- Chapter 11: Types of IPO Investors in Stock Market
- Chapter 12: IPO Process- From Merchant Banker to Company Listing
- Chapter 13: IPO investment and FPO
- Chapter 14: Important things and Advantages of IPO Investment
- Chapter 15: Corporate Actions: Meaning, Types & Examples
- Chapter 16: Bonus Issue and Rights Issue
- Chapter 17: Corporate Action Purpose and Participation Method
- Chapter 1: Stock Valuation Terms Explained – Part 1
- Chapter 2: Stock Market Valuation- Important Ratios and Terms
- Chapter 3: Types of Stocks in Share Market- Part 1
- Chapter 4 –Types of Stocks in Share Market- Part 2
- Chapter 5: Taxation on Stock Investments – Part 1
- Chapter 6 – Taxation on Stock Investments – Part 2
- Chapter 7 - Difference Between Micro & Macro Economics
- Chapter 8 – Inflation and its Impact on the Economy
- Chapter 9 - Introduction to Economic Policies – Part 1
- Chapter 10 – Introduction to Economic Policies – Part 2
- Chapter 11 – GDP and the Government Budget
- Chapter 12 - How Foreign Investments Influence Business Cycles
- Chapter 13 - Economic Indicators
- Chapter 14 - Behavioural Biases and Common Pitfalls in Investment – Part 1
- Chapter 15 - Behavioural Biases and Common Pitfalls in Investment – Part 2
- Chapter 16 - Behavioural Biases and Common Pitfalls in Investment – Part 3
Chapter 13 - Economic Indicators
Imagine a scenario. It's the T20 finals. Your friends are sure The Royal Tigers will win. But somehow you're not convinced. You have been closely following Adil Sharma -- the season’s dark horse batting for Super Sunrisers -- for a long time. You've watched every match he’s played, and you're convinced he holds the key to taking his team to victory. You believe the pitch he is currently batting on is his favourite. And you’re also of the opinion that he has arrived at the right time to pivot the match in his team's favor.
But how do you know all this? What is it about this specific batsman that convinces you he is in a good form?
That's because, you have checked his:
- Overall run score
- Excellent strike rate
- Consistency over a long period
And, you have been absolutely correct! True to your belief, Adil Sharma steered Super Sunrisers to victory, leaving your friends amazed at your predictions.
So, does this mean your favourite batsman will score well always?
Not necessarily.
The above indicators show your favourite batsman’s potential to perform at his current physical prowess. His fitness and form are currently determining his performance. But it may not always be so.
This brings us back to today’s chapter.
How can you gauge the health and performance on the country’s economy?
To gauge the overall health of the economy, financial experts and economists use economic indicators.
Economic indicators
These economic indicators can be just about anything that helps investors like you and me to understand the economy’s status and condition.
Some common ones include: the stock market, advance tax deposits, Index of Industrial Production (IIP), GDP, inflation, interest rates, Current Account Deficit (CAD), Purchasing Manager Index (PMI), crude oil prices, etc.
Additional read: Economics for Stock Market
Let’s go through a few key ones:
Index of Industrial Production (IIP)
The IIP is an index that tracks the manufacturing activities of various sectors in an economy. It broadly covers the activity in the manufacturing, mining and quarrying and electricity sectors.
IIP data is published by the Central Statistics Office (CSO) under the Ministry of Statistics and Programme Implementation on 12th day of every month with a lag of around six weeks.
Although the IIP indicates the condition of the country’s economy, it must not be taken as the sole basis for investments.
IIP data is broadly divided into three segments, namely -
- Manufacturing (77.63% weight)
- Mining and quarrying (14.37% weight)
- Electricity (7.99% weight)
* data as per the base year 2011-12
Did you know?
IIP index is currently calculated using 2011-2012 as the base year.
Purchase Managers’ Index (PMI)
You may be aware that the health of the manufacturing sector is a leading indicator that predicts growth or recession.
That’s where we have the Purchase Managers’ Index (PMI), which is an indicator of business activities in the manufacturing and services sectors. It captures information by surveying purchasing managers of various companies on production levels, orders from new customers, inventories, etc. It is considered one of the best leading economic indicators to forecast future economic scenarios.
Crude oil
The petrol or diesel that runs your car.
The gas that lights your stove.
These are examples of crude oil which is our next economic indicator.
How does something like oil and gas shed light on an economy's progress?
Oil, gas and petroleum operate like just any other commodity market. Since it is a produced commodity, it is driven by supply and demand as well as the cost to produce, extract and refine the natural resources.
Crude oil or oil and gas in the petroleum industry is a popular indicator and its fluctuating numbers or stock levels give oil traders an idea of its consumption and production over a specific period.
Additional read: What determines the prices of Crude Oil?
But what makes crude oil so important?
As you know, crude oil can be refined into usable fuel products like gas or petrol. Therefore, it is one of the most critical fuel sources and is one of the largest sectors in the world.
Since oil is essential for many businesses such as airlines, manufacturers, transportation, and agriculture, crude becomes a critical commodity for an economy. As only a few countries produce it so most of the countries, including India, import it.
So changes in crude oil prices significantly impact our trade deficits and make it an important economic indicator. Higher crude oil prices may widen Current Account Deficit (CAD) and so, it may be considered as a negative factor for the Indian economy. Whereas, falling crude prices reduce import bills and help reduce CAD. That’s why, falling crude prices are considered positive for the Indian economy.
To understand how Current Account Deficit (CAD) affects the economy, revisit Chapter 11.
To make it simple for you, here’s what you need to know -
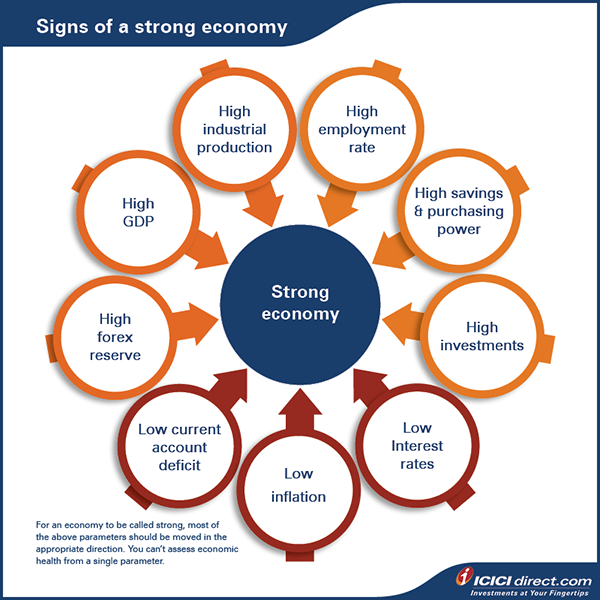
- If the Gross Domestic Product (GDP) growth rate is high, it is a sign of a good economy.
- Higher IIP numbers are also a sign of growth in industrial output.
- Inflation should be in the normal range; very high or low inflation are not good signs.
- Low interest rates are desirable in an economy for growth.
- CAD within the range of 3-4% of GDP is considered normal, and debt beyond these limits can adversely impact the economic scenario.
- A rising foreign exchange reserves would be a reflection of a good economic condition.
Additional read: The Relation Between the GDP and Stock Market that We Need to Know
But remember, it may be possible that one of the indicators may show a different picture of the economy. It is always better to collectively analyze indicators to understand the overall state of the economy.
So, in short, this is what a strong economy would look like:
Economic indicators and market
Economic indicators help predict market trend.
Since the stock market takes cues from the health of the economy, economic indicators can help you understand the state of the economy. They can allow you to manage your investments as per the current scenario. Some leading indicators can also help you forecast the next stage of business cycles.
For instance, the GDP, PMI, IIP data, etc. are highly positively correlated with the stock market.
Conversely, interest rate, unemployment data, inflation, etc. are highly negatively correlated with the stock market.
How do economic indicators affect different sectors or industries?
Growth in IIP numbers is a good sign for the cement and steel industries. IIP data is purely industrial data, so the banking sector is not included in it. But increase in production and investment activity is usually financed through borrowings from banks. If industrial production and capital spending increase, it is likely to impact the banking sector positively.
Capital intensive industries are most affected by high interest rates but when interest rates are low, they gain the most. It is better to avoid investments in real estate, automobiles etc. when interest rates are rising.
Companies with a high proportion of loans in their balance sheets are seriously affected by high-interest rates. Companies with zero or near zero debts in their balance sheets will have the least impact in a rising interest rate scenario.
FMCG is considered a defensive sector due to its low debt nature. Rising interest rates are associated with slower growth rates of bank loans and deposits.
Sectors like IT are less affected by interest rates. The IT sector is more influenced by currency rate fluctuations, rising attrition levels, visa restrictions, competition from prominent global players and margin pressures. Indeed, IT sectors are not interest rate sensitive.
But wouldn’t the stock market itself indicate the economic situation of the country?
Yes, the stock market is also an important indicator of the economy.
Any broad stock market index which covers a majority of sectors and companies could be a good predictor of the economic condition of a country. The GDP of a country depends on the production output of companies and the stock index is a good representation of these companies. That’s why a broad stock index is a good indicator of the health of an economy.
Important dates
Now that you know the economics of the stock market, let’s look at some of the important dates for the stock markets in India:
|
Companies’ quarterly results |
|
|
Budget day (February 1) |
|
|
RBI’s policy review dates |
|
|
GDP data |
|
|
Inflation data |
|
|
IIP data |
|
|
Last Thursday of every month |
|
Summary
- Economic indicators such as advance tax deposits, Index of Industrial Production (IIP), GDP, inflation, interest rates, Current Account Deficit (CAD), Purchasing Manager Index (PMI), crude oil prices, etc., Are useful in gauging the overall health of the economy.
- The Index of Industrial Production (IIP) tracks manufacturing activities of various sectors in an economy.
- To help predict growth or recession, using Purchase Managers’ Index (PMI) gives an indication of the health of the manufacturing and service sector.
- Any broad stock market index that covers a wide range sectors and companies is also a good predictor of a country's economic conditions.
By now we've explained broad complicated economic topics through simple to understand, day-to-day examples. Let's move on to behavioural biases and common pitfalls in investments.
Disclaimer: ICICI Securities Ltd.( I-Sec). Registered office of I-Sec is at ICICI Securities Ltd. - ICICI Venture House, Appasaheb Marathe Marg, Mumbai - 400025, India, Tel No : 022 - 2288 2460, 022 - 2288 2470. I-Sec is a Member of National Stock Exchange of India Ltd (Member Code :07730) and BSE Ltd (Member Code :103) and having SEBI registration no. INZ000183631. Name of the Compliance officer (broking): Mr. Anoop Goyal, Contact number: 022-40701000, E-mail address: complianceofficer@icicisecurities.com. Investment in securities market are subject to market risks, read all the related documents carefully before investing. Composite Corporate Agent License No.CA0113, AMFI Regn. No.: ARN-0845. PFRDA registration numbers: POP no -05092018. We are distributors of Insurance and Mutual funds, Corporate Fixed Deposits, NCDs, PMS and AIF products. We act as a Syndicate, Sub -syndicate member for IPO, FPO. Please note that Mutual Fund Investments are subject to market risks, read the scheme related documents carefully before investing for full understanding and detail. . ICICI Securities Ltd. acts as a referral agent to ICICI Bank Ltd., ICICI Home Finance Company Limited and various other banks / NBFC for personal finance, housing related services etc. & the loan facility is subjective to fulfilment of eligibility criteria, terms and conditions etc. NPS is a defined contribution plan and the benefits would depend upon the amounts of contributions invested and the investment growth up to the point of exit from NPS. Insurance is the subject matter of solicitation. ICICI Securities Ltd. does not underwrite the risk or act as an insurer. The contents herein above shall not be considered as an invitation or persuasion to trade or invest. I-Sec and affiliates accept no liabilities for any loss or damage of any kind arising out of any actions taken in reliance thereon.The non-broking products / services like Mutual Funds, Insurance, FD/ Bonds, loans, PMS, Tax, Elocker, NPS, IPO, Research, Financial Learning etc. are not exchange traded products / services and ICICI Securities Ltd. is just acting as a distributor/ referral Agent of such products / services and all disputes with respect to the distribution activity would not have access to Exchange investor redressal or Arbitration mechanism.


COMMENT (0)