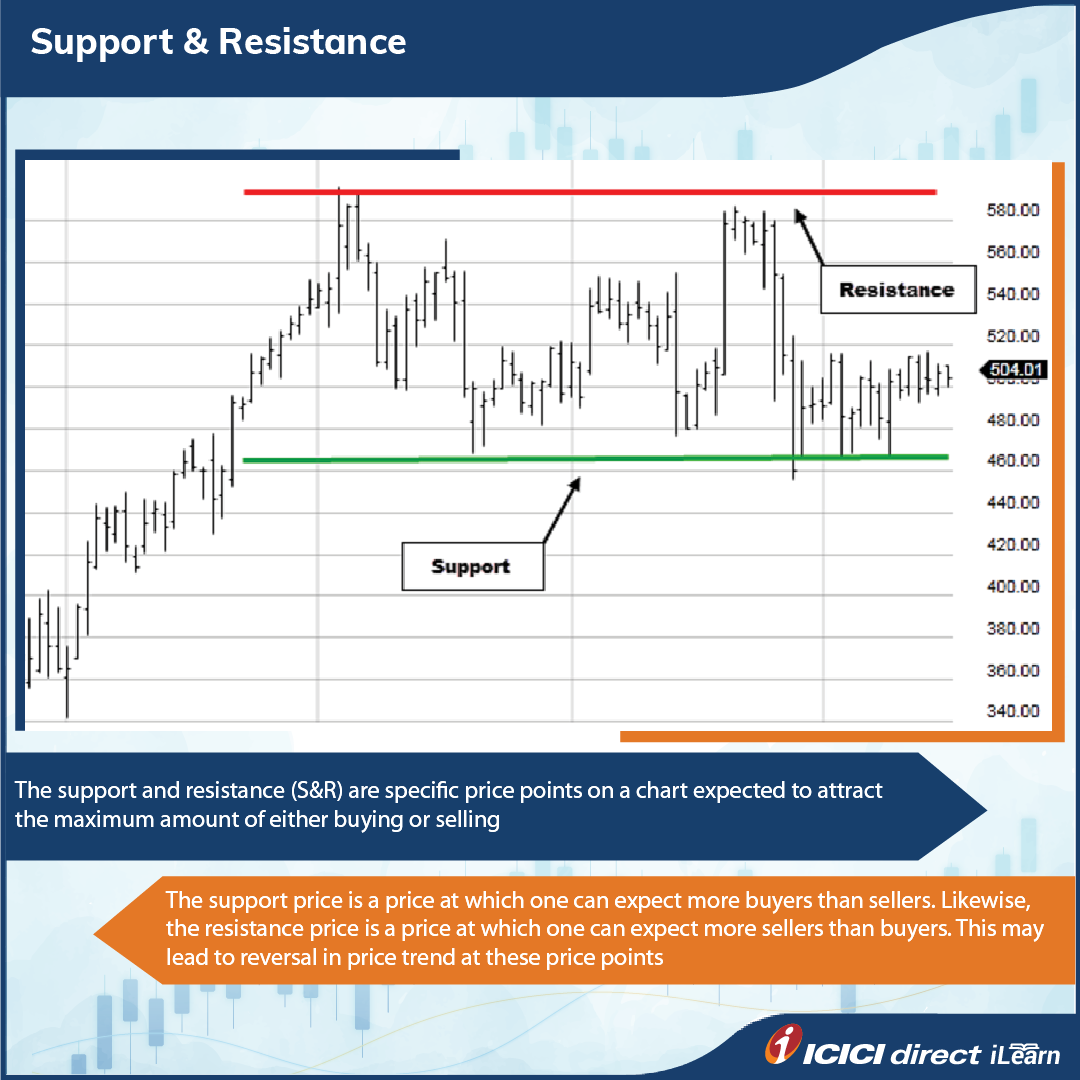
Knowing support and resistance is important in technical analysis. These levels attract high trading volume. For more information, please refer to this infographic
https:/www.icicidirect.com/ilearn/technical-analysis/infographics/support-and-resistance
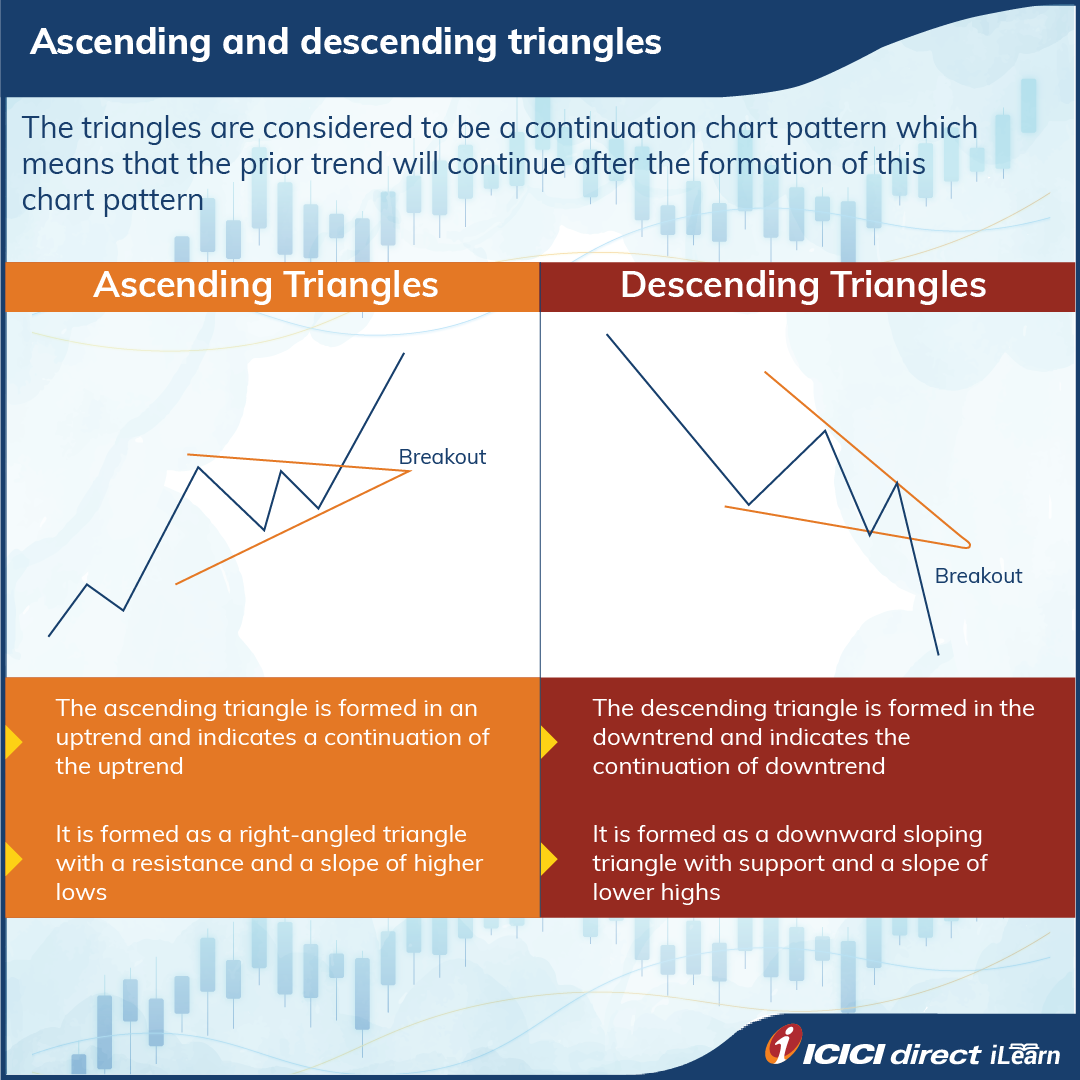
Triangle patterns are a commonly used tool in technical analysis. Triangle patterns help us identify the continuation or reversal of bullish or bearish trends in the market. Learn more about it here
https:/www.icicidirect.com/ilearn/technical-analysis/infographics/ascending-and-descending-triangles
Price and volume analysis is an essential aspect of technical analysis used by traders to better understand an asset’s price and volume movement. Learn more about it here
https:/www.icicidirect.com/ilearn/technical-analysis/infographics/the-price-volume-connection
Traders use MACD to identify trend changes, momentum, and potential buying and selling opportunities. It is calculated using two exponential moving averages (EMAs) of different lengths. Learn more about this here
https:/www.icicidirect.com/ilearn/technical-analysis/infographics/moving-averages-convergence-divergence-macd-
The RSI is a tool for analysing price strength and identifying overbought/oversold conditions. See the infographic for the pros and cons of using it
https:/www.icicidirect.com/ilearn/technical-analysis/infographics/pros-and-cons-of-relative-strength-index-rsi-
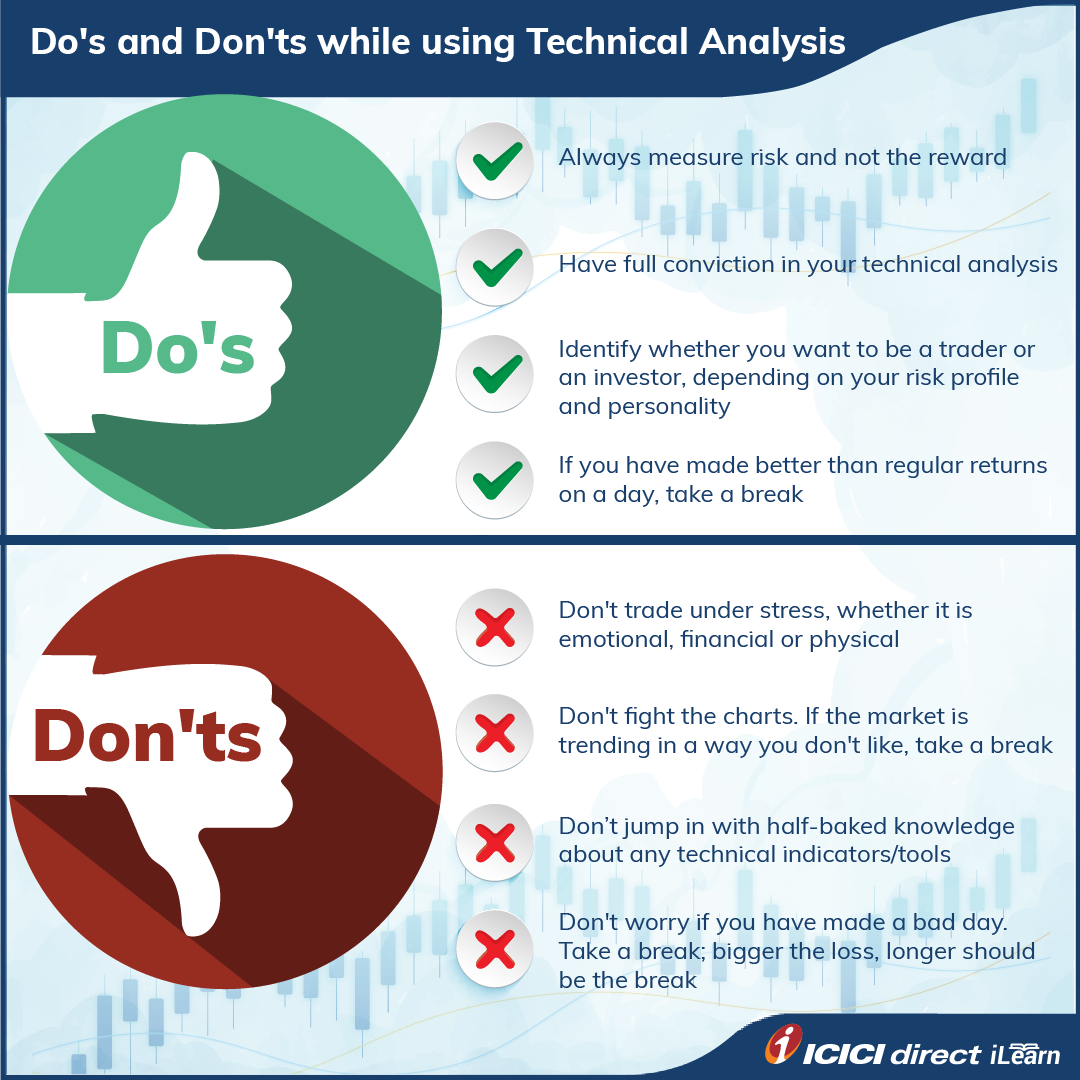
Let us quickly learn about some do's and don'ts of effective trading using technical analysis in this infographic
https:/www.icicidirect.com/ilearn/technical-analysis/infographics/do-s-and-don-ts-while-using-technical-analysis
of legacy
App Rating
 Top Mutual Funds


-202310181216454374070.png)
-202310181220590281475.png)