 Top Mutual Funds

- 09 Aug 2023
- ICICIdirect
-
Share
-

-

-

-

-

TVS SUPPLY CHAIN IPO OPENS FOR SUBSCRIPTION ON 10TH AUGUST
Many IPO are lined up in August. Earlier in the month, we have seen good retail participation in Concord Biotech and SBFC Finance IPO. In the next couple of weeks, we have many more lined up.
Today, we will discuss TVS Supply Chain Solutions Limited IPO, which opens for subscription on 10th August and closes on 14th August. The various aspects related to the company will help you decide whether to subscribe or invest in the IPO for the long term.
TVS Supply Chain IPO: Key Details
Below are the key details related to the TVS Supply Chain IPO:
- Issue Size: Rs 880 crore
- Price Band: Rs 187 - Rs 197
- Issue Details: Rs 600 crore Fresh Issue + Rs 280 crore Offer For Sale (OFS)
- Market Cap: At the upper price band, Rs 8,746 crore
- Minimum Investment: Rs 14,972
TVS Supply Chain: About the Business
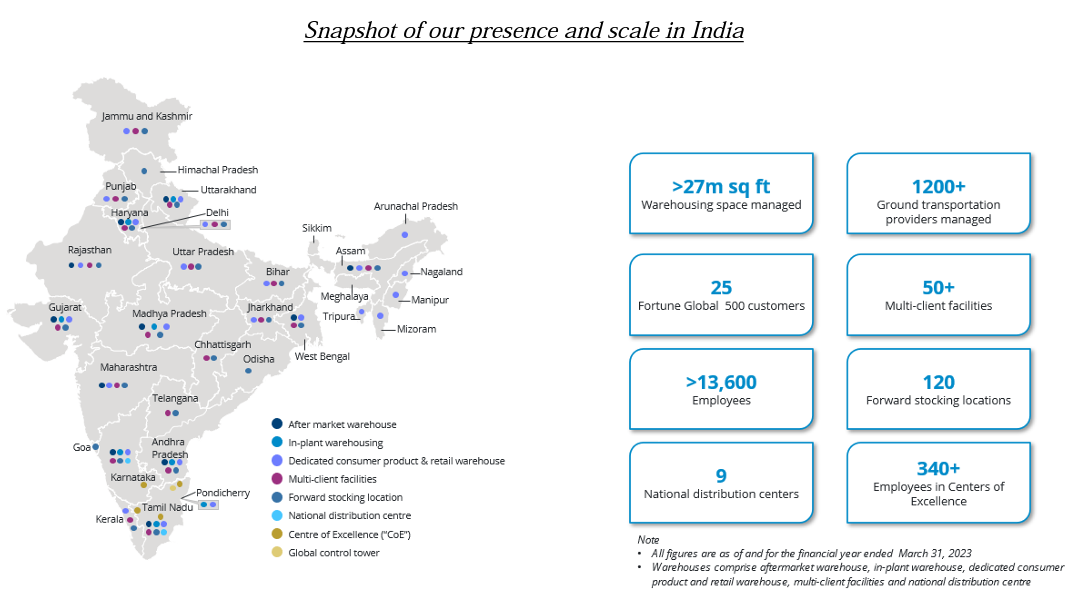
TVS Supply Chain is India's largest and among the fastest growing integrated supply chain solutions provider among Indian listed supply chain solutions companies in terms of revenues and revenue growth, respectively, in FY23 (Redseer report).
They are an Indian supply chain logistics solution provider that has global capabilities and a network across the value chain with cross-deployment abilities. Technology coupled with their deep domain expertise and global expertise enables them to develop and offer customized solutions to customers’ thereby empowering agile and efficient supply chains at a large scale.
TVS Supply Chain also provides solutions and services to meet customers’ supply chain management and logistics requirements. Their solutions spanning the entire value chain from sourcing to consumption can be divided into two segments:
- Integrated supply chain solutions (ISCS) - In FY23, they provided services to 412 customers in the ISCS segment.
- Network solutions (NS) - In FY23, they provided services to 8,376 customers in the NS segment.
TVS Supply Chain customers span across numerous industries - automotive, industrial, consumer, tech and tech infra, rail and utilities, and healthcare.
TVS Supply Chain: Industry Overview
The Indian logistics sector is one of the largest in the world and is critical for the country’s economic growth. After contracting by 2% in FY21, the market witnessed a strong post-COVID recovery in FY22. The market grew by 14% and was valued at $435 billion in FY22 and is projected to grow to $591 billion by FY27.
India’s logistics spending, as a percentage of GDP, is significantly higher compared to developed countries, due to the high incidence of indirect spending. It is similar to China (approximately 15%), as against 8% in the US and Germany in 2021.
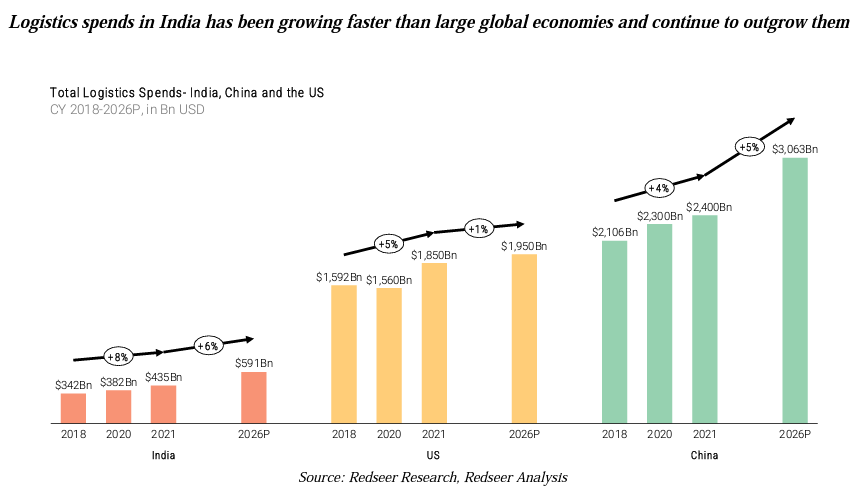
The Indian logistics market has been highly fragmented and has experienced rapid growth in the organized market in recent years. The Indian logistics market has grown from $342 billion to $435 billion between 2018 and 2021 at a CAGR of approximately 8%. This is more than the growth that the Chinese market and the American market experienced during the same period at a CAGR of 4% and 5%, respectively.
The Indian logistics market is projected to grow at a higher CAGR of approximately 6% between 2021 and 2026. During the same period, the Chinese logistics market is expected to expand at a CAGR of 5% (approx), while the US market is expected to expand at a CAGR of approximately 1%.
TVS Supply Chain: Peer Comparison
TVS Supply Chain has many listed peers - TCI Express, Mahindra Logistics, BlueDart Express and Delhivery. Let us compare TVS Supply Chain with peers among different parameters for FY23:
- In terms of revenue, TVS Supply Chain is the biggest player followed by Delhivery and then Mahindra Logistics.
- However, EBITDA margins are the lowest among all the peers. The highest is for BlueDart Express.
- BlueDart has the maximum profit among all the listed peers, while Mahindra Logistics has the lowest (among those reporting profit). Delhivery has reported losses.
- Earning Per Share (EPS) is the lowest among all the peers for TVS Supply Chain (among profitable companies), and the highest is for BlueDart.
- The average RONW of listed peers is 14.48%, TVS Supply Chain's RoNW stood at 5.50%,
TVS Supply Chain: Financials
Let us now look at the most crucial part that one needs to consider while evaluating a new company (and also a new company). Below are the financial numbers of TVS Supply Chain over the last three financial years:
- The company has reported a revenue of Rs 6,933.60 crore, Rs 9,249.79 crore, and Rs 10,235.38 crore for FY21, FY22, and FY23, respectively. The revenue has grown at a strong 21.5% CAGR.
- For FY21, FY22, and FY23, the EBITDA reported by the company was Rs 442.34 crore, Rs 667.09 crore, and Rs 706.60 crore, respectively. The EBITDA margin has remained more or the less than same. EBITDA margins for the same period were 6.38%, 7.21%, and 6.90%, respectively.
- In FY21 and FY22, the company reported a loss of Rs (76.34) crore and Rs (45.80) crore, respectively. In FY23, the company turned profitable and reported a profit of Rs 41.76 crore.
- For the last three financial years, the company has reported an average EPS of Rs (0.35) and an average RoNW of (2.07) %.
- If we attribute FY23 earnings to post-IPO fully diluted paid-up equity capital, then, the asking price is at a P/E of 209.57 and discounts all near-term positive.
- The Return on Capital Employed (ROCE) for the last three financial years is (4.56)%, 6.65%, and 7.64%, respectively.
- The Debt to Equity Ratio is on the higher side. However, it has come down from 2.92 in FY21 to 1.61 in FY23.
What are the competitive strengths of the TVS Supply Chain?
As per the company, their competitive strengths are as below:
- They provide specialized solutions to reduce complexity in their customers' supply chains by using technology, data analytics, and execution experience to offer key solutions such as accurate demand forecasting, inventory planning, production, etc.
- The company is focused on moving up the customer’s value chain with a varied range of technology-based solutions.
- They are empowered with artificial intelligence, machine learning, and big data analytics capabilities. As a result, the algorithms make informed decisions at every level of their business, providing real-time data analytics to optimize network density and equipment utilization across their entire network.
- They operate an asset-light business wherein their warehouses and vehicles are operated through leases with their network partners.
Risks associated with the TVS Supply Chain
Below are the risks associated with the TVS Supply Chain business:
- They have incurred losses in FY21 and FY22, and any similar losses in the future will impact their business.
- The company is exposed to foreign currency exchange rate fluctuation as for FY21, FY22, and FY23, an average of 72.99% of their revenue from operations was denominated in foreign currencies, and an average of 73.87% of their borrowings were in foreign currencies in the same years.
- TVS Supply Chain has increasing working capital requirements and may require additional financing to meet those requirements.